. 2015 Nov 2;125(11):4053-62.
doi: 10.1172/JCI81187. Epub 2015 Sep 28.

TIGIT predominantly regulates the immune response via regulatory T cells

TIGIT predominantly regulates the immune response via regulatory T cells

Sema Kurtulus et al. J Clin Invest. .

Retraction in

Abstract

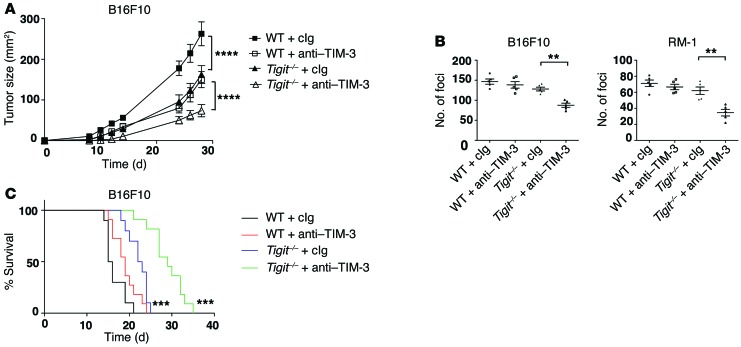
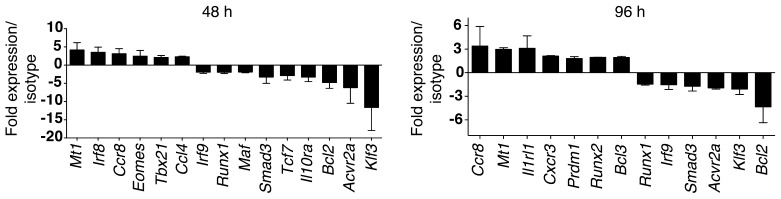
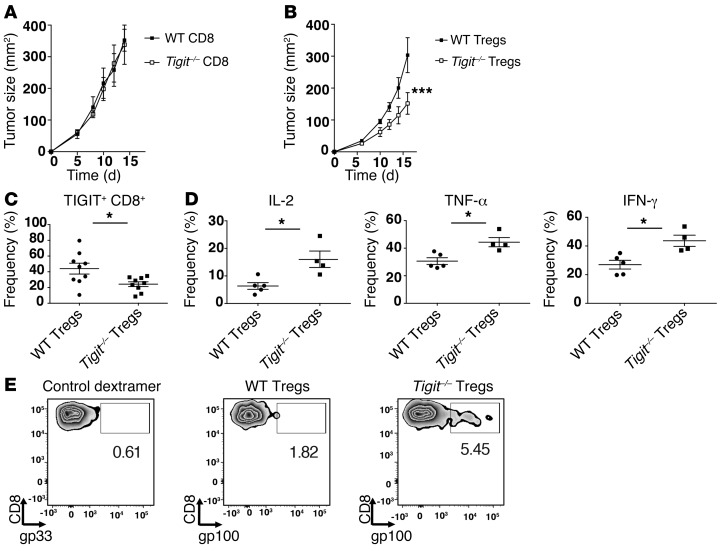
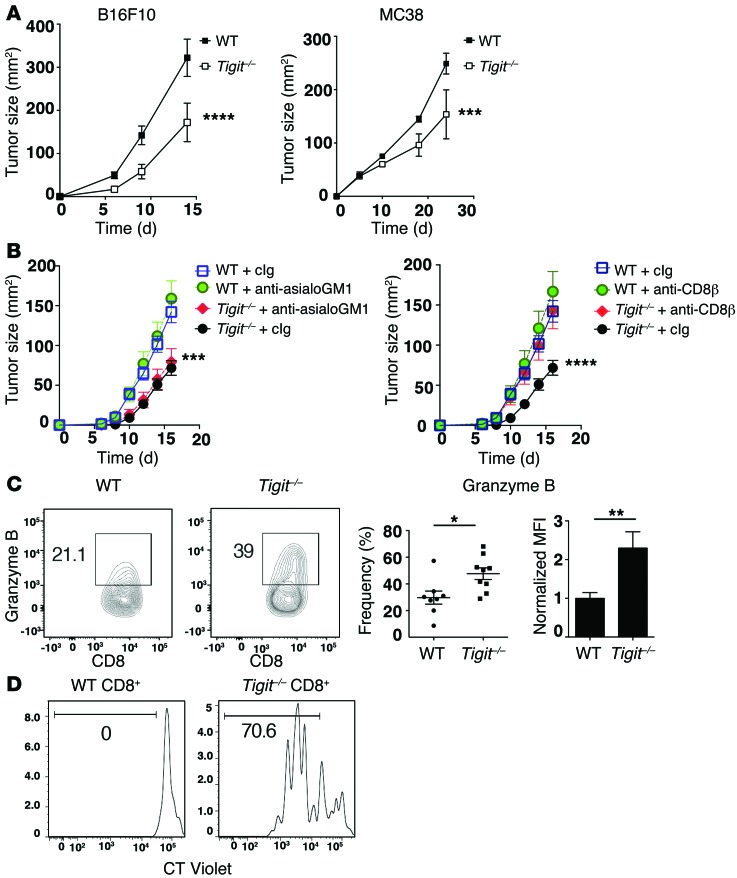
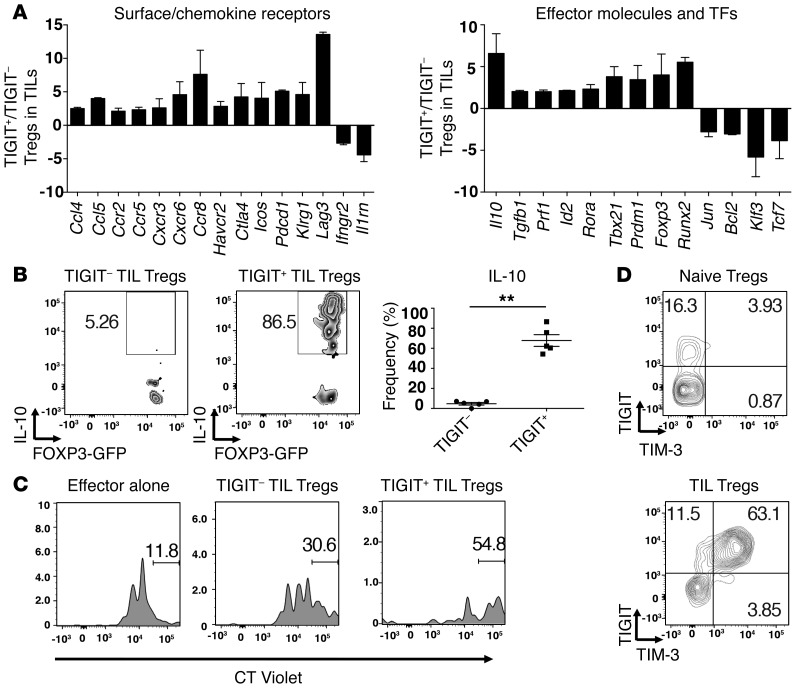
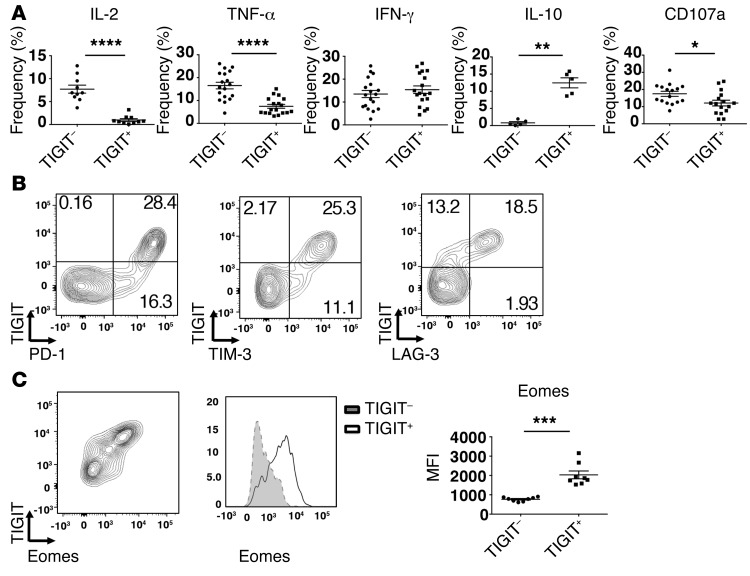
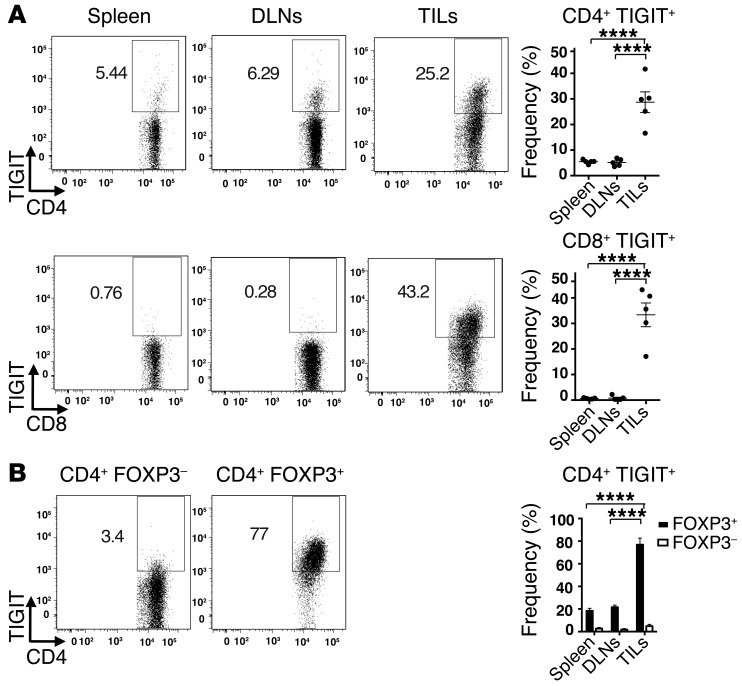
Coinhibitory receptors are critical for the maintenance of immune homeostasis. Upregulation of these receptors on effector T cells terminates T cell responses, while their expression on Tregs promotes their suppressor function. Understanding the function of coinhibitory receptors in effector T cells and Tregs is crucial, as therapies that target coinhibitory receptors are currently at the forefront of treatment strategies for cancer and other chronic diseases. T cell Ig and ITIM domain (TIGIT) is a recently identified coinhibitory receptor that is found on the surface of a variety of lymphoid cells, and its role in immune regulation is just beginning to be elucidated. We examined TIGIT-mediated immune regulation in different murine cancer models and determined that TIGIT marks the most dysfunctional subset of CD8+ T cells in tumor tissue as well as tumor-tissue Tregs with a highly active and suppressive phenotype. We demonstrated that TIGIT signaling in Tregs directs their phenotype and that TIGIT primarily suppresses antitumor immunity via Tregs and not CD8+ T cells. Moreover, TIGIT+ Tregs upregulated expression of the coinhibitory receptor TIM-3 in tumor tissue, and TIM-3 and TIGIT synergized to suppress antitumor immune responses. Our findings provide mechanistic insight into how TIGIT regulates immune responses in chronic disease settings.


Figures

Figure 7
Figure 7. TIM-3 and TIGIT synergize to suppress antitumor immunity.
(A) WT and Tigit–/– mice (n = 5) were implanted s.c. with B16F10 melanoma cells and treated with 250 μg isotype or anti–TIM-3 (RMT3-23) Ab on days 3, 6, 9, and 12. Statistical comparisons are between WT plus Ig and Tigit–/– plus Ig and between Tigit–/– plus Ig and Tigit–/– plus anti–TIM-3. ****P < 0.0001 by repeated-measures ANOVA with a Sidak test. Data are representative of 2 experiments. (B and C) B16F10 melanoma cells or RM-1 cells were administered i.v. to WT mice (n = 5 per group) that were treated i.p. with 250 μg isotype (cIg) and/or anti–TIM-3 (RMT3-23) Ab on days 0 and 3. (B) Graphs show the number of foci ± SEM in the lungs after B16F10 (left) or RM-1 (right) cell injections on day 14. Statistical comparisons are between Tigit–/– plus cIg and Tigit–/– plus anti–TIM-3. **P < 0.01 by Mann-Whitney U test. Data are representative of 2 experiments. (C) Survival of mice (n = 10 per group) after i.v. administration of B16F10 melanoma cells. Statistical comparisons are between WT plus cIg and Tigit–/– plus cIg and between Tigit–/– plus cIg and Tigit–/– plus anti–TIM-3. ***P < 0.001 by log-rank test. Data were pooled from 2 independent experiments.
Figure 6
Figure 6. TIGIT signaling in Tregs.
CD4+ FOXP3+ Tregs from WT Foxp3-GFP–KI mice were sorted and stimulated with plate-bound isotype or agonistic anti-TIGIT Ab, together with anti-CD3 and anti-CD28, for 48 or 96 hours. Gene expression was then analyzed using a NanoString CodeSet. Bar graphs show the fold expression ± SEM of genes in Ab-treated versus isotype-treated cells at 48 and 96 hours. Data were pooled from 2 different experiments.
Figure 5
Figure 5. TIGIT expression on Tregs has a dominant role compared with CD8+ T cells in regulating antitumor responses.
(A) CD8+ T cells from WT or Tigit–/– mice were mixed with WT CD4+ (FOXP3+ and FOXP3) T cells and injected i.v. into Rag–/– mice (n = 5). Two days later, mice were implanted with B16F10 tumor cells. Graph shows tumor growth over time. Data are representative of 3 different experiments. (B) Tregs from WT or Tigit–/– Foxp3-GFP–KI mice were mixed with WT CD8+ and CD4+ FOXP3 cells and transferred into Rag–/– mice (n = 5). Graph shows tumor growth over time. Data are representative of 5 different experiments. ***P < 0.001 by repeated-measures ANOVA with a Sidak test. (CE) Seventeen days after implantation, TILs and DLNs were isolated from mice that received WT or Tigit–/– Tregs. (C) Frequency ± SEM of TIGIT+ CD8+ TILs from each group (n = 9–10). Data were pooled from 2 independent experiments. (D) TILs were stimulated with anti-CD3 and anti-CD28 and analyzed for cytokine production. Graphs show IL-2+, TNF-α+, and IFN-γ+ percentages ± SEM within CD8+ TILs in each group (n = 4–5). *P < 0.05 by Mann-Whitney U test (C and D). (E) Representative plots show gp33 (control dextramer) or gp100 dextramer staining in CD8+ T cells from pooled DLNs of Rag–/– mice. (D and E) Data are representative of 2 independent experiments.
Figure 4
Figure 4. TIGIT restrains antitumor immune responses.
(A) Growth of B16F10 melanoma or MC38 colon carcinoma in WT or Tigit–/– mice (n = 5–6). Data are representative of 3 independent experiments. ***P < 0.001 and ****P < 0.0001 by repeated-measures ANOVA with a Sidak test. (B) WT or Tigit–/– mice (n = 5) were treated i.p. with anti-asialoGM1 or anti-CD8β Abs or with their isotype controls (cIg) on days –1, 0, 7, and 14 after B16F10 tumor implantation. Tumor growth after anti-asialoGM1 (left) or anti-CD8β (right) treatment is shown. Data are representative of 2 independent experiments. Comparisons are between WT plus cIg versus Tigit–/–, irrespective of cIg or anti-asialoGM1 treatment (left), and between cIg versus anti-CD8β in Tigit–/– mice (right). ***P < 0.001 and ****P < 0.0001 by repeated-measures ANOVA with a Sidak test. (C and D) Total TILs were isolated from B16F10 tumor–bearing WT or Tigit–/– mice (n = 4–5). (C) TILs were stimulated with 10 μg/ml gp100 peptide. Contour plots and bar graphs show the percentage ± SEM of granzyme B+ cells and the normalized MFI of granzyme B expression within CD8+ TILs. MFI was normalized to the mean of WT CD8+ TILs in each independent experiment. Data were pooled from 2 to 3 experiments. *P < 0.05 and **P < 0.01 by Mann-Whitney U test. (D) CT Violet–labeled TILs were stimulated with anti-CD3 for 4 days and then analyzed by flow cytometry. Representative histogram of CT Violet dilution in CD8+ TILs. Data are representative of 3 individual measurements.
Figure 3
Figure 3. TIGIT+ Tregs in the tumor tissue exhibit a more suppressive and activated phenotype.
TIGIT+ and TIGIT Tregs were isolated from B16F10 tumors implanted into Foxp3-GFP–KI mice (A, C, and D) or IL-10-Thy1.1 Foxp3-GFP–KI mice (B). (A) Gene expression was analyzed using a custom NanoString CodeSet. Bar graphs show the fold expression ± SEM of selected differentially expressed surface receptors (left), effector molecules, and transcription factors (TFs) (right) in TIGIT+ and TIGIT Tregs. Data are pooled from 2 different experiments. Selected genes with a fold change of greater than 2 are depicted. (B) Left panels: representative flow cytometric data showing IL-10-Thy1.1 staining in TIGIT and TIGIT+ Treg TILs. Right panel: frequency ± SEM of IL-10+ cells within TIGIT and TIGIT+ Treg TILs (n = 5). Data are representative of 2 independent experiments. **P < 0.01 by Mann-Whitney U test. (C) Tregs isolated from tumor tissue were cocultured with splenic CT Violet–labeled CD4+ T cells (1:8). CT Violet dilution was analyzed by flow cytometry 4 days later. Gates indicate the undivided CD4+ subsets. Data are representative of 2 experiments. (D) Representative contour plots of TIM-3 expression on TIGIT+ TIL Tregs or TIGIT+ naive Tregs. Data are representative of 5 individual mice.
Figure 2
Figure 2. TIGIT marks a dysfunctional CD8+ T cell subset.
TILs were harvested from WT mice (n = 5–20) or IL-10 Thy1.1 mice (n = 5) bearing B16F10 melanoma 12–15 days after tumor implantation when tumor sizes measured between 140 and 180 mm2. (A) Frequency ± SEM of CD8+ TIGIT+ and TIGIT TILs producing IL-2, TNF-α, IFN-γ, and IL-10 (Thy1.1) or expressing surface CD107a after stimulation with anti-CD3 and anti-CD28. Data were pooled from 3 different experiments. (B) Representative flow cytometric data showing TIGIT coexpression with PD-1, TIM-3, and LAG-3 on CD8+ TILs. Data are representative of 5 individual mice. (C) Left panel: representative contour plot showing TIGIT coexpression with eomes in CD8+ TILs. Middle panel: representative histogram showing eomes expression in TIGIT+ and TIGIT CD8+ TILs. Right panel: mean fluorescence intensity (MFI) ± SEM for eomes in TIGIT+ and TIGIT CD8+ TILs (n = 8 mice). Data were pooled from 2 different experiments. ****P < 0.0001, ***P < 0.001, **P < 0.01, and *P < 0.05 by Mann-Whitney U test.
Figure 1
Figure 1. TIGIT is enriched on TILs.
Spleen, tumor DLNs, and TILs were harvested from WT Foxp3-GFP–KI mice (n = 5) bearing B16F10 melanoma tumors and stained with Abs against CD4, CD8, and TIGIT. (A) Left panels: representative flow cytometric data showing TIGIT expression on CD4+ and CD8+ T cells in spleen, DLNs, and TILs. Right panel: frequency ± SEM of TIGIT+ cells. ****P < 0.0001 by 1-way ANOVA and Tukey’s multiple comparisons test. (B) Left panels: representative flow cytometric data showing TIGIT expression in CD4+ FOXP3 (GFP) and CD4+ FOXP3+ (GFP+) in TILs. Right panel: frequency ± SEM of TIGIT+ FOXP3 and FOXP3+ cells. CD4+ FOXP3+ percentages within total CD4+ T cells were 32.46% ± 4.27%. Data are representative of 2 to 3 experiments. ****P < 0.0001 by 1-way ANOVA and Tukey’s multiple comparisons test comparing TIGIT+ FOXP3+ cells across the indicated tissues.

References

    1. Wherry EJ. T cell exhaustion. Nat Immunol. 2011;12(6):492–499. - PubMed
    1. Page DB, Postow MA, Callahan MK, Allison JP, Wolchok JD. Immune modulation in cancer with antibodies. Annu Rev Med. 2014;65:185–202. doi: 10.1146/annurev-med-092012-112807. - DOI - PubMed
    1. Tumeh PC, et al. PD-1 blockade induces responses by inhibiting adaptive immune resistance. Nature. 2014;515(7528):568–571. doi: 10.1038/nature13954. - DOI - PMC - PubMed
    1. Yu X, et al. The surface protein TIGIT suppresses T cell activation by promoting the generation of mature immunoregulatory dendritic cells. Nat Immunol. 2009;10(1):48–57. doi: 10.1038/ni.1674. - DOI - PubMed
    1. Boles KS, et al. A novel molecular interaction for the adhesion of follicular CD4 T cells to follicular DC. Eur J Immunol. 2009;39(3):695–703. doi: 10.1002/eji.200839116. - DOI - PMC - PubMed

Publication types

MeSH terms