

doi: 10.1038/nn.4126.
Epub 2015 Sep 28.
CD33 modulates TREM2: convergence of Alzheimer loci
Affiliations
- PMID: 26414614
- PMCID: PMC4682915
- DOI: 10.1038/nn.4126
Item in Clipboard
CD33 modulates TREM2: convergence of Alzheimer loci
Nat Neurosci.
2015 Nov.
Abstract
We used a protein quantitative trait analysis in monocytes from 226 individuals to evaluate cross-talk between Alzheimer loci. The NME8 locus influenced PTK2B and the CD33 risk allele led to greater TREM2 expression. There was also a decreased TREM1/TREM2 ratio with a TREM1 risk allele, decreased TREM2 expression with CD33 suppression and elevated cortical TREM2 mRNA expression with amyloid pathology.
Figures
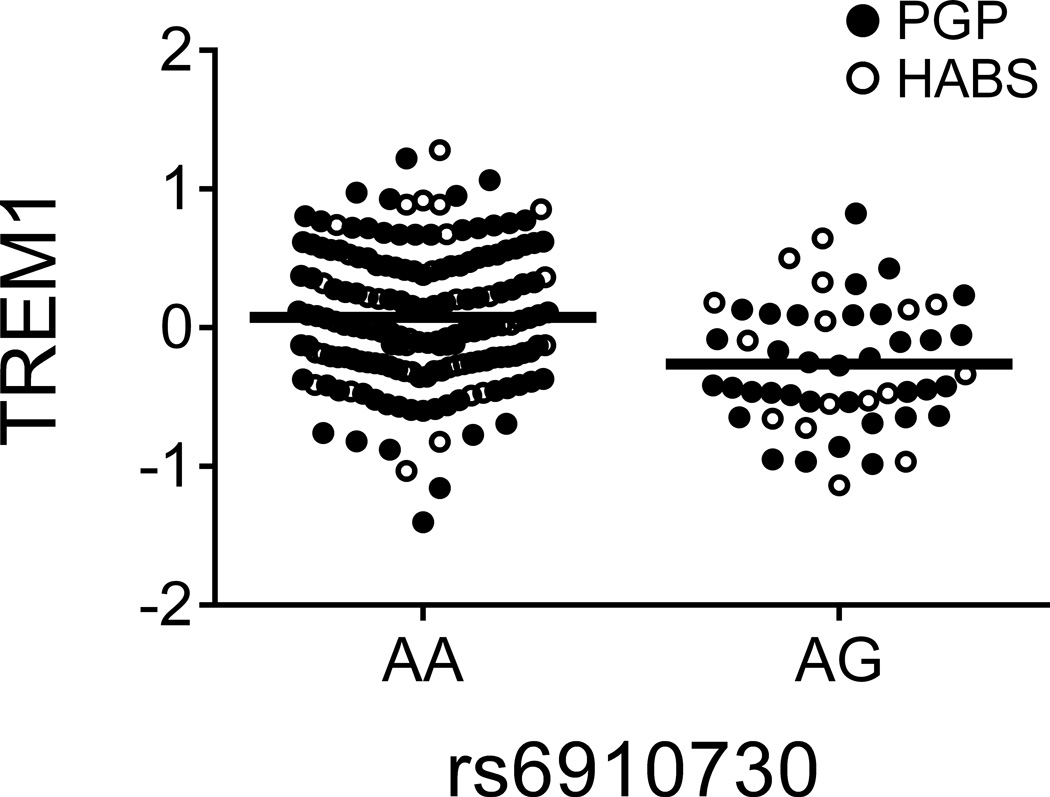
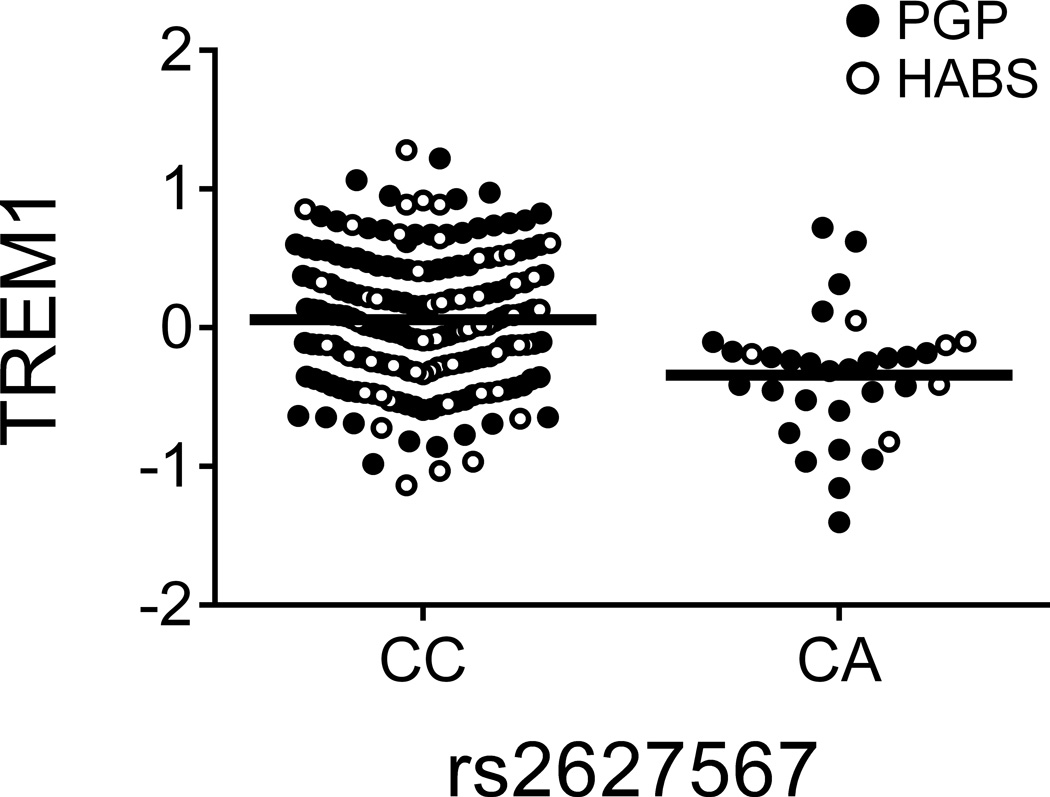
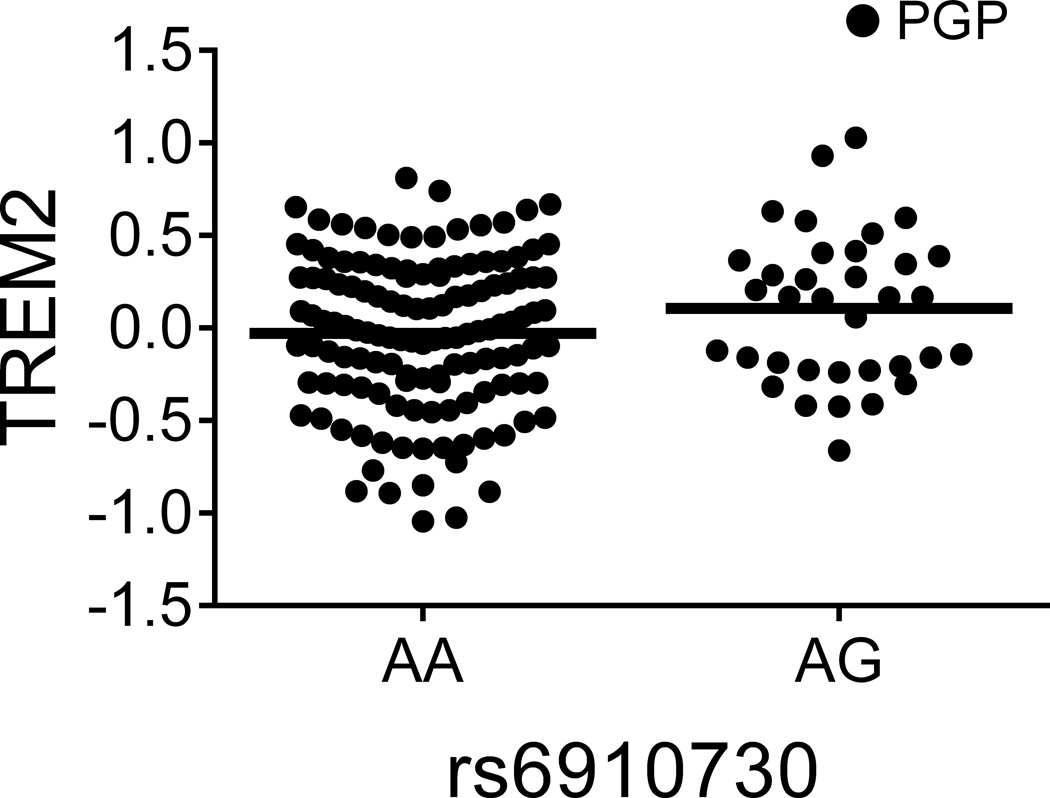
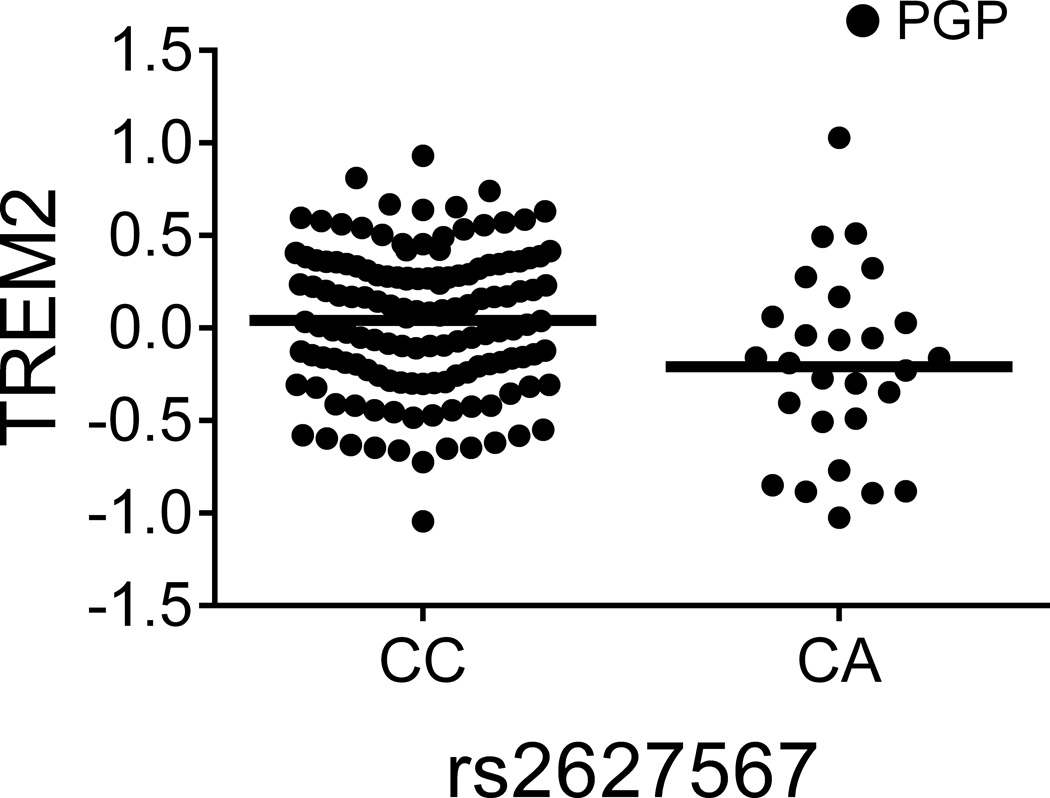
(a and b) The TREM1 AD-risk allele rs6910730G and the non-disease associated TREM1 allele rs2627567A are associated with lower TREM1 expression. (Note: two rs6910730 GG subjects are combined with the AG subjects). (c and d) Stratified analyses limited to the larger collection of PGP subjects (combining the discovery and replication PGP samples): rs6910730G is associated with an increase in TREM2 (whereas rs2627567A is associated with a decrease in TREM2), resulting in a greater reduction in the TREM1/TREM2 ratio than that caused by the reduction in TREM1 expression alone (Supplementary Fig. 3b). TREM1 and TREM2 surface expression on monocytes was quantified via flow cytometry; the y-axis represents normalized median fluorescence intensity (MFI) and the horizontal line denotes mean MFI. Each dot represents one individual from either the PGP (●) or HABS (○) cohort.
(a and b) The TREM1 AD-risk allele rs6910730G and the non-disease associated TREM1 allele rs2627567A are associated with lower TREM1 expression. (Note: two rs6910730 GG subjects are combined with the AG subjects). (c and d) Stratified analyses limited to the larger collection of PGP subjects (combining the discovery and replication PGP samples): rs6910730G is associated with an increase in TREM2 (whereas rs2627567A is associated with a decrease in TREM2), resulting in a greater reduction in the TREM1/TREM2 ratio than that caused by the reduction in TREM1 expression alone (Supplementary Fig. 3b). TREM1 and TREM2 surface expression on monocytes was quantified via flow cytometry; the y-axis represents normalized median fluorescence intensity (MFI) and the horizontal line denotes mean MFI. Each dot represents one individual from either the PGP (●) or HABS (○) cohort.
(a and b) The TREM1 AD-risk allele rs6910730G and the non-disease associated TREM1 allele rs2627567A are associated with lower TREM1 expression. (Note: two rs6910730 GG subjects are combined with the AG subjects). (c and d) Stratified analyses limited to the larger collection of PGP subjects (combining the discovery and replication PGP samples): rs6910730G is associated with an increase in TREM2 (whereas rs2627567A is associated with a decrease in TREM2), resulting in a greater reduction in the TREM1/TREM2 ratio than that caused by the reduction in TREM1 expression alone (Supplementary Fig. 3b). TREM1 and TREM2 surface expression on monocytes was quantified via flow cytometry; the y-axis represents normalized median fluorescence intensity (MFI) and the horizontal line denotes mean MFI. Each dot represents one individual from either the PGP (●) or HABS (○) cohort.
(a and b) The TREM1 AD-risk allele rs6910730G and the non-disease associated TREM1 allele rs2627567A are associated with lower TREM1 expression. (Note: two rs6910730 GG subjects are combined with the AG subjects). (c and d) Stratified analyses limited to the larger collection of PGP subjects (combining the discovery and replication PGP samples): rs6910730G is associated with an increase in TREM2 (whereas rs2627567A is associated with a decrease in TREM2), resulting in a greater reduction in the TREM1/TREM2 ratio than that caused by the reduction in TREM1 expression alone (Supplementary Fig. 3b). TREM1 and TREM2 surface expression on monocytes was quantified via flow cytometry; the y-axis represents normalized median fluorescence intensity (MFI) and the horizontal line denotes mean MFI. Each dot represents one individual from either the PGP (●) or HABS (○) cohort.
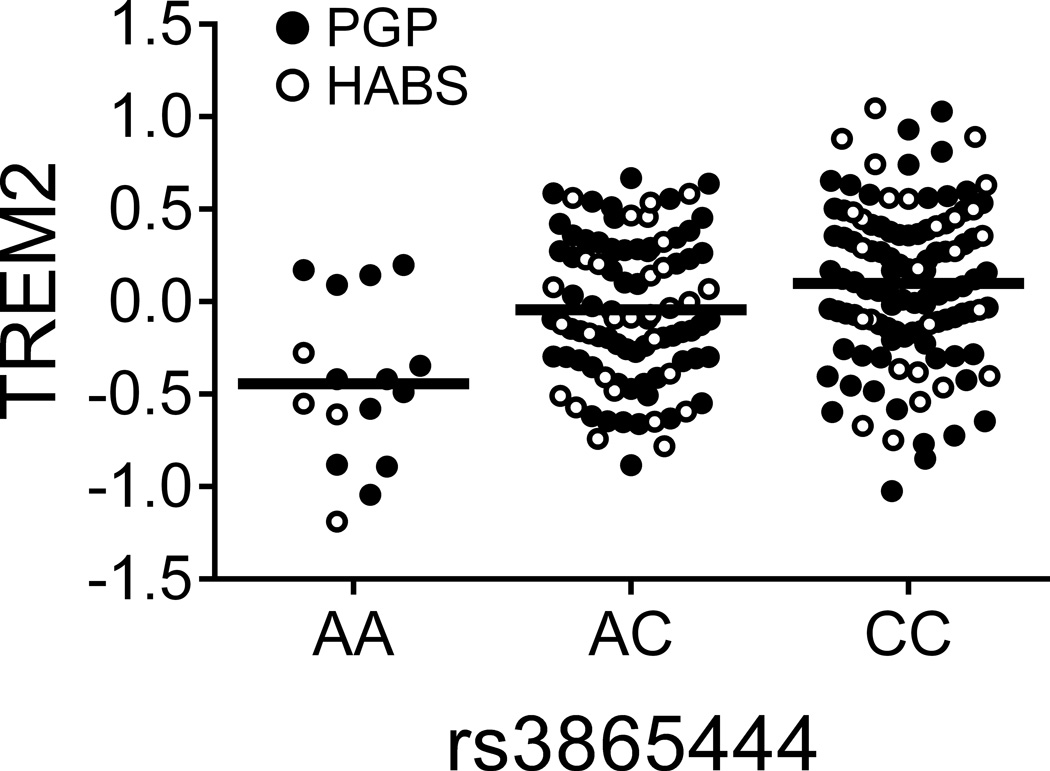
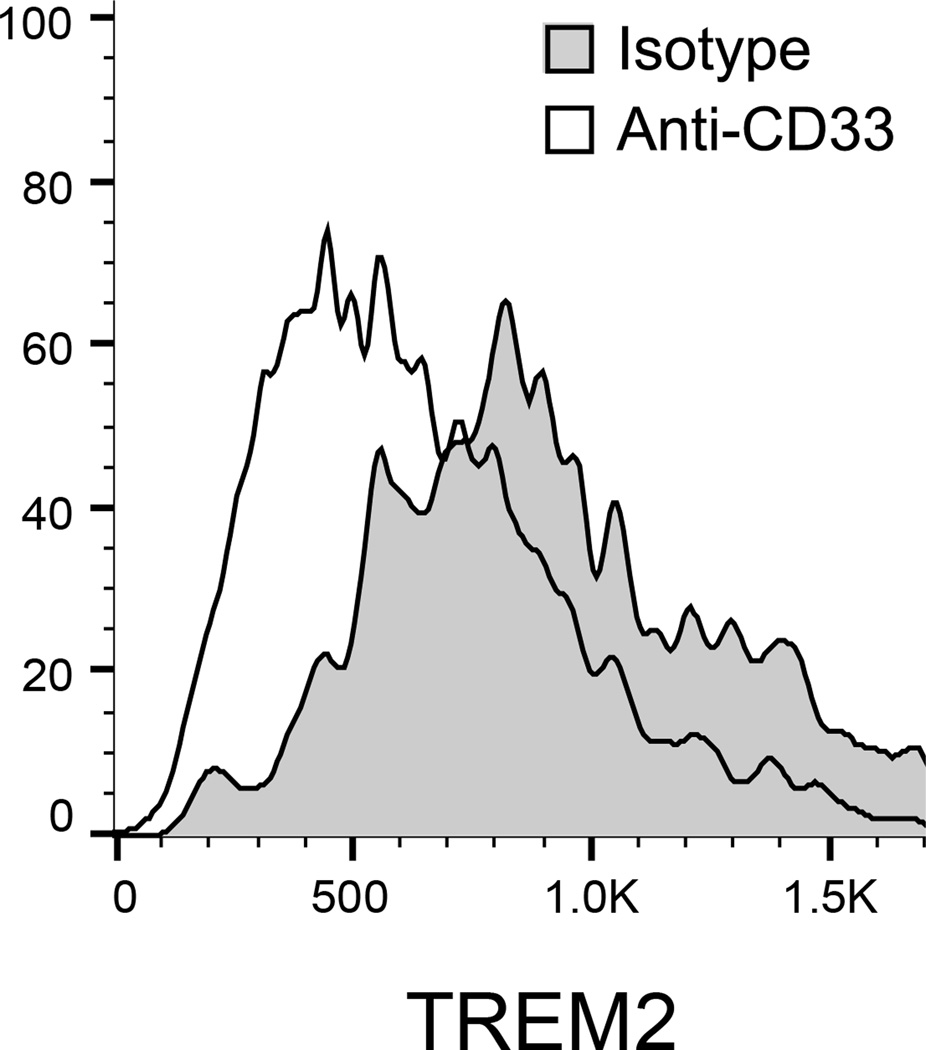
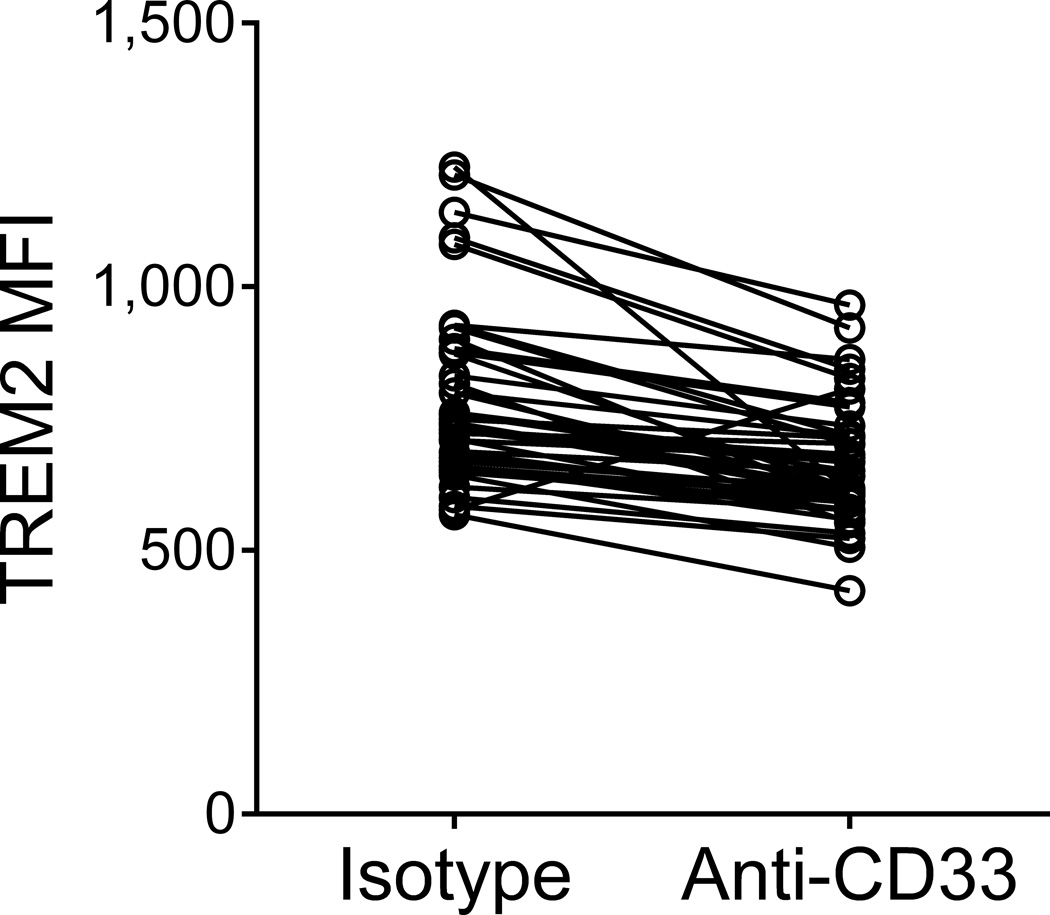
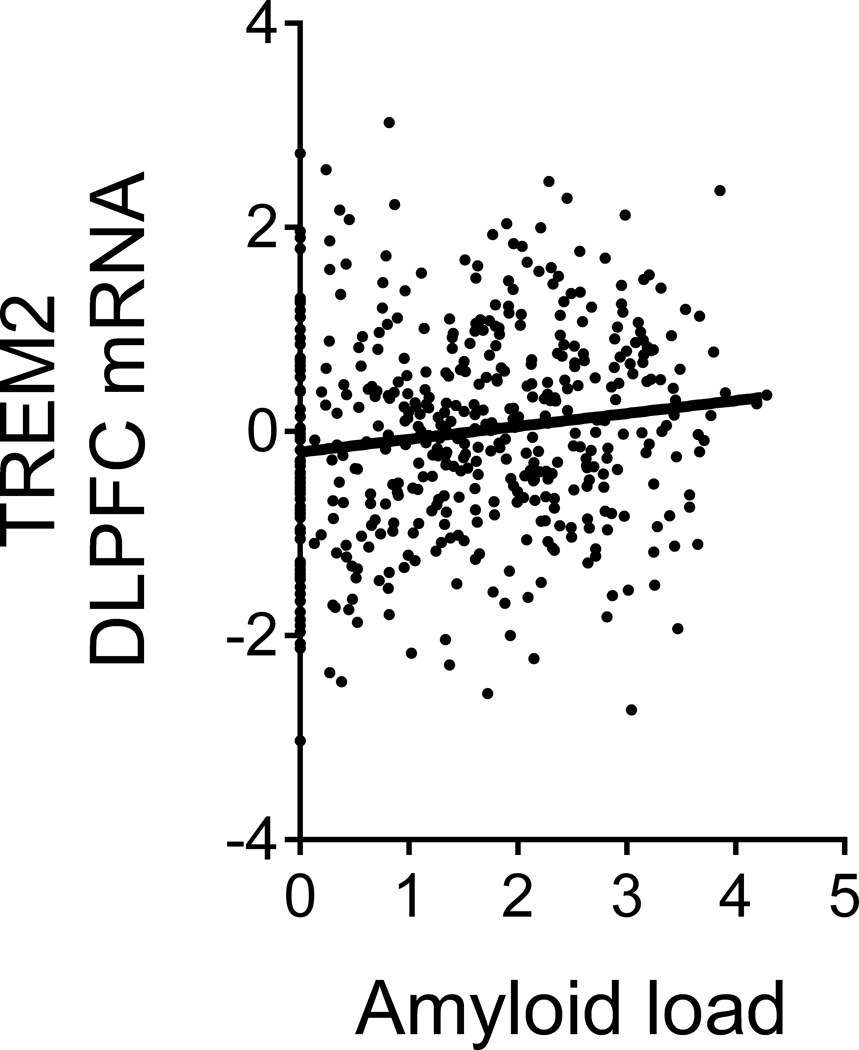
(a) The CD33 risk allele rs3865444C, which is associated with increased CD33 expression, was also associated with increased TREM2 surface expression on monocytes. TREM2 was quantified via flow cytometry; the y-axis represents normalized MFI and the horizontal line denotes mean MFI. (b) Representative histogram of TREM2 expression on monocytes from one subject; in the presence of the anti-CD33 antibody (Ab), the distribution of TREM2 staining shifts left when compared to monocytes treated with non-specific isotype control Ab. (c) TREM2 MFI of monocytes treated with anti-CD33 Ab decreases compared to monocytes treated with isotype control Ab. Lines connect paired samples for each individual. (d) TREM2 mRNA expression in dorsolateral prefrontal cortex tissue in relation to amyloid load. The y-axis represents mRNA expression values log2 transformed and normalized. Each data point represents one individual.
(a) The CD33 risk allele rs3865444C, which is associated with increased CD33 expression, was also associated with increased TREM2 surface expression on monocytes. TREM2 was quantified via flow cytometry; the y-axis represents normalized MFI and the horizontal line denotes mean MFI. (b) Representative histogram of TREM2 expression on monocytes from one subject; in the presence of the anti-CD33 antibody (Ab), the distribution of TREM2 staining shifts left when compared to monocytes treated with non-specific isotype control Ab. (c) TREM2 MFI of monocytes treated with anti-CD33 Ab decreases compared to monocytes treated with isotype control Ab. Lines connect paired samples for each individual. (d) TREM2 mRNA expression in dorsolateral prefrontal cortex tissue in relation to amyloid load. The y-axis represents mRNA expression values log2 transformed and normalized. Each data point represents one individual.
(a) The CD33 risk allele rs3865444C, which is associated with increased CD33 expression, was also associated with increased TREM2 surface expression on monocytes. TREM2 was quantified via flow cytometry; the y-axis represents normalized MFI and the horizontal line denotes mean MFI. (b) Representative histogram of TREM2 expression on monocytes from one subject; in the presence of the anti-CD33 antibody (Ab), the distribution of TREM2 staining shifts left when compared to monocytes treated with non-specific isotype control Ab. (c) TREM2 MFI of monocytes treated with anti-CD33 Ab decreases compared to monocytes treated with isotype control Ab. Lines connect paired samples for each individual. (d) TREM2 mRNA expression in dorsolateral prefrontal cortex tissue in relation to amyloid load. The y-axis represents mRNA expression values log2 transformed and normalized. Each data point represents one individual.
(a) The CD33 risk allele rs3865444C, which is associated with increased CD33 expression, was also associated with increased TREM2 surface expression on monocytes. TREM2 was quantified via flow cytometry; the y-axis represents normalized MFI and the horizontal line denotes mean MFI. (b) Representative histogram of TREM2 expression on monocytes from one subject; in the presence of the anti-CD33 antibody (Ab), the distribution of TREM2 staining shifts left when compared to monocytes treated with non-specific isotype control Ab. (c) TREM2 MFI of monocytes treated with anti-CD33 Ab decreases compared to monocytes treated with isotype control Ab. Lines connect paired samples for each individual. (d) TREM2 mRNA expression in dorsolateral prefrontal cortex tissue in relation to amyloid load. The y-axis represents mRNA expression values log2 transformed and normalized. Each data point represents one individual.
References
Publication types
MeSH terms
Substances
Grants and funding
- U01 AG046152/AG/NIA NIH HHS/United States
- R01 AG17917/AG/NIA NIH HHS/United States
- RF1 AG015819/AG/NIA NIH HHS/United States
- K25 AG041906/AG/NIA NIH HHS/United States
- P01 AG036694/AG/NIA NIH HHS/United States
- R01 AG043617/AG/NIA NIH HHS/United States
- R01 AG017917/AG/NIA NIH HHS/United States
- P50 AG005134/AG/NIA NIH HHS/United States
- R01 AG048015/AG/NIA NIH HHS/United States
- P30 AG10161/AG/NIA NIH HHS/United States
- U01 AG46152/AG/NIA NIH HHS/United States
- P30 AG010161/AG/NIA NIH HHS/United States
- R01 AG15819/AG/NIA NIH HHS/United States
- R01 AG036836/AG/NIA NIH HHS/United States
- R01 AG015819/AG/NIA NIH HHS/United States
LinkOut - more resources
Full Text Sources
Other Literature Sources
Medical
Miscellaneous
