. 2015 Nov;47(11):1228-35.
doi: 10.1038/ng.3404. Epub 2015 Sep 28.

Partitioning heritability by functional annotation using genome-wide association summary statistics

Affiliations

Partitioning heritability by functional annotation using genome-wide association summary statistics

Hilary K Finucane et al. Nat Genet. 2015 Nov.

Abstract

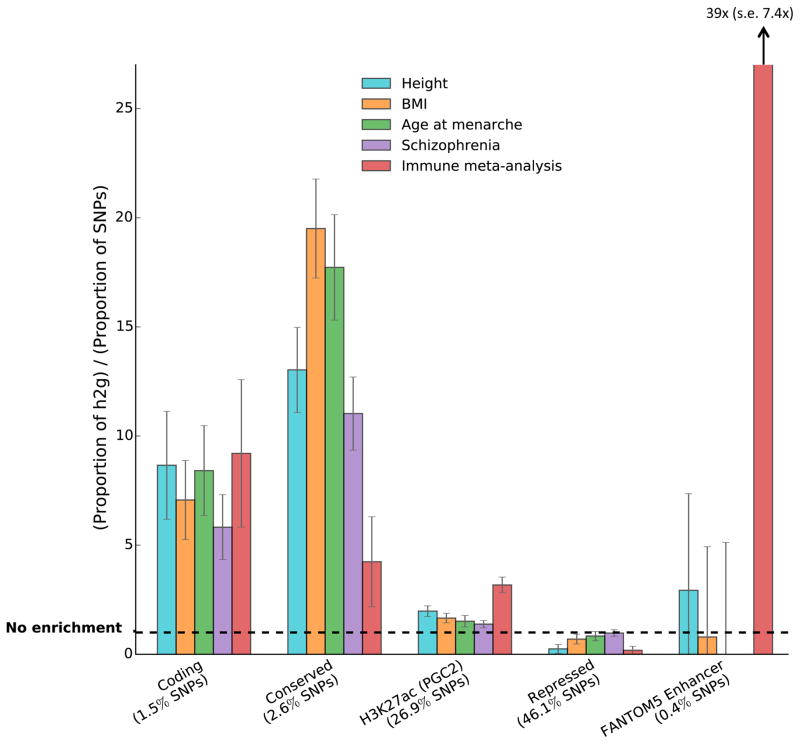
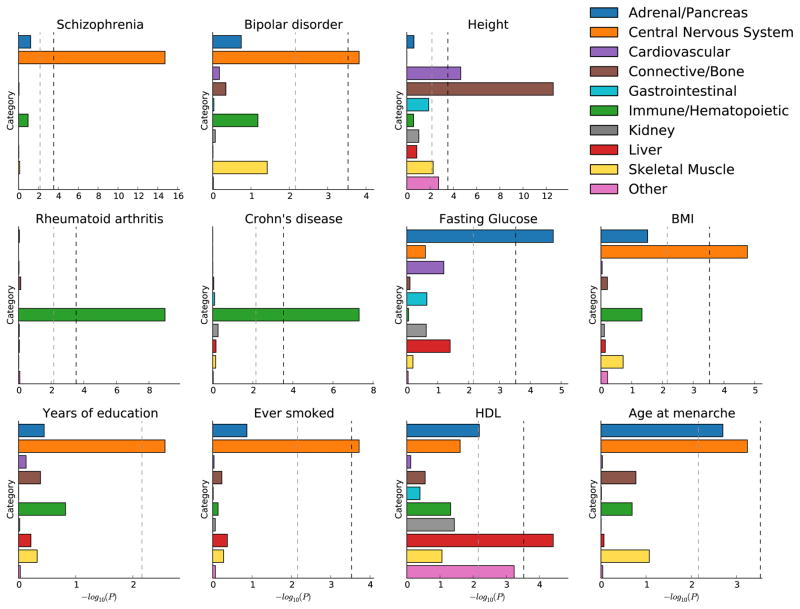
Recent work has demonstrated that some functional categories of the genome contribute disproportionately to the heritability of complex diseases. Here we analyze a broad set of functional elements, including cell type-specific elements, to estimate their polygenic contributions to heritability in genome-wide association studies (GWAS) of 17 complex diseases and traits with an average sample size of 73,599. To enable this analysis, we introduce a new method, stratified LD score regression, for partitioning heritability from GWAS summary statistics while accounting for linked markers. This new method is computationally tractable at very large sample sizes and leverages genome-wide information. Our findings include a large enrichment of heritability in conserved regions across many traits, a very large immunological disease-specific enrichment of heritability in FANTOM5 enhancers and many cell type-specific enrichments, including significant enrichment of central nervous system cell types in the heritability of body mass index, age at menarche, educational attainment and smoking behavior.


Conflict of interest statement

The authors have no competing financial interests.

Figures

Figure 1
Figure 1
Simulation results: null calibration and power. We simulated genetic architectures with positive total SNP-heritability, with and without functional enrichment, for two values of pcausal and a range of values of N·hg2. (a) Proportion of simulations in which a null of no functional enrichment is rejected, as a function of N·hg2 and pcausal. (b) The z-score of total SNP-heritability depends on N·hg2 and pcausal, but does not depend on the presence or absence of functional enrichment. (c) Proportion of simulations in which a null of no functional enrichment is rejected, as a function of the z-score of total SNP-heritability. Here, the z-score of total SNP-heritability for pcausal = 0.005 did not exceed 7.3 even at maximum N·hg2.
Figure 2
Figure 2
Simulation results: model misspecification. Enrichment is the proportion of heritability in DHS regions divided by the proportion of SNPs in DHS regions. Bars show 95% confidence intervals around the mean of 100 trials. (a) From left to right, the simulated genetic architectures are 1x DHS enrichment, 3x DHS enrichment, and 5.5x DHS enrichment (100% of heritability in DHS SNPs). (b) From left to right, the simulated genetic architectures are 200bp flanking regions causal, coding regions causal, and FANTOM5 Enhancer regions causal. For simulations with coding or FANTOM5 Enhancer as the causal category, we removed the causal category and the 500bp window around that category from the full baseline model in order to simulate enrichment in an unknown functional category.
Figure 3
Figure 3
Simulation results for ranking cell-type groups and cell types. For each cell-type group, 500 simulations were performed with baseline enrichment and either realistic enrichment or low enrichment in that cell-type group. Results for the left two columns are aggregated over the ten cell-type groups; results for individual groups are displayed in Supplementary Figure 5. The right two columns represent 500 simulations each of realistic or low enrichment of a single cell-type-specific annotation, H3K4me3 in fetal brain cells.
Figure 4
Figure 4
Enrichment estimates for the 24 main annotations, averaged over nine independent traits. Annotations are ordered by size. Error bars represent jackknife standard errors around the estimates of enrichment, and stars indicate significance at P < 0.05 after Bonferroni correction for 24 hypotheses tested. Negative point estimates, significance testing, and the choice of nine independent traits are discussed in the Online Methods and Supplementary Note.
Figure 5
Figure 5
Enrichment estimates for selected annotations and traits. Error bars represent jackknife standard errors around the estimates of enrichment.
Figure 6
Figure 6
Enrichment of cell-type groups. We report significance of enrichment for each of 10 cell-type groups, for each of 11 traits. The black dotted line at −log10(P) = 3.5 is the cutoff for Bonferroni significance. The grey dotted line at −log10(P) = 2.1 is the cutoff for FDR < 0.05. For HDL, three of the top individual cell types are adipose nuclei, which explains the enrichment of the “Other” category.
Figure 7
Figure 7
Comparison to other methods for identifying enriched cell types. In “Null” simulations, there is no enrichment. In “Null (baseline enrichment)” simulations, there is enrichment in the baseline categories, some of which overlap the cell type or cell-type group, but no additional enrichment in the cell type or cell-type group. In the “True enrichment” simulations, there is enrichment in either the CNS cell-type group (top panels) or the fetal brain cell type (bottom babels). In all simulations, N = 14000, hg2 = 0.7. We report the proportion of 100 simulations in which the null is rejected by six methods: GoShifter [6], fgwas [9], Top SNPs [10], PICS [7], stratified LD score (unadjusted), and LD score. LD score (unadj) refers to total unadjusted enrichment, i.e., (Prop. hg2)/(Prop. SNPs); LD score refers to the coefficient β of the category, controlling for all other categories in the model.

References

    1. Yang J, et al. Common SNPs explain a large proportion of the heritability for human height. Nature Genetics. 2010;42(7):565–569. - PMC - PubMed
    1. Stahl EA, et al. Bayesian inference analyses of the polygenic architecture of rheumatoid arthritis. Nature Genetics. 2012;44(5):483–489. - PMC - PubMed
    1. ENCODE Project Consortium. An integrated encyclopedia of DNA elements in the human genome. Nature. 2012;489:57–74. - PMC - PubMed
    1. Roadmap Epigenomics Consortium et al. Integrative analysis of 111 reference human epigenomes. Nature. 2015;518:317–330. - PMC - PubMed
    1. Trynka G, et al. Chromatin marks identify critical cell types for fine mapping complex trait variants. Nature Genetics. 2013;45(2) - PMC - PubMed

Publication types