. 2015 Nov;16(11):1142-52.
doi: 10.1038/ni.3268. Epub 2015 Sep 28.

Kinases Mst1 and Mst2 positively regulate phagocytic induction of reactive oxygen species and bactericidal activity

Affiliations

Kinases Mst1 and Mst2 positively regulate phagocytic induction of reactive oxygen species and bactericidal activity

Jing Geng et al. Nat Immunol. 2015 Nov.

Abstract

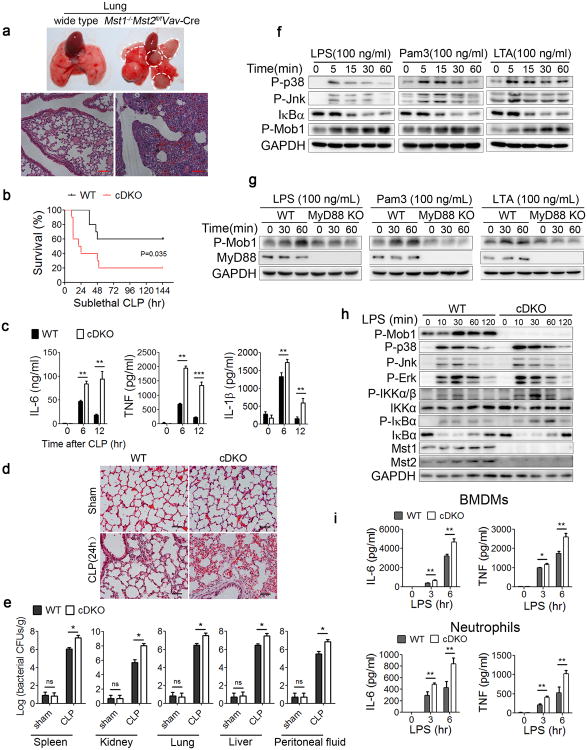
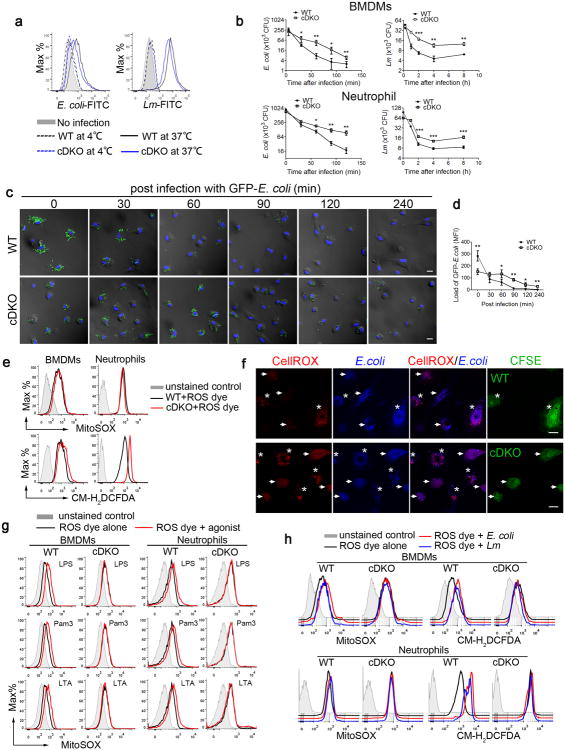
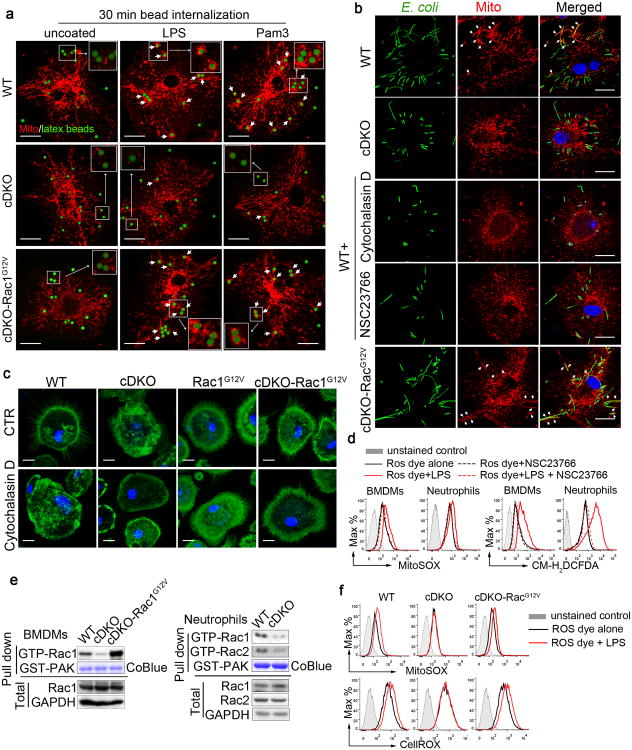
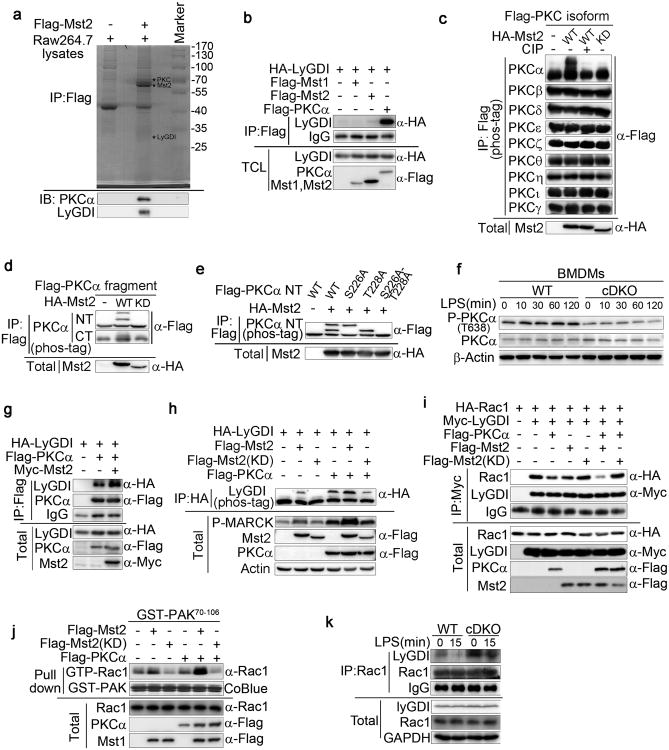
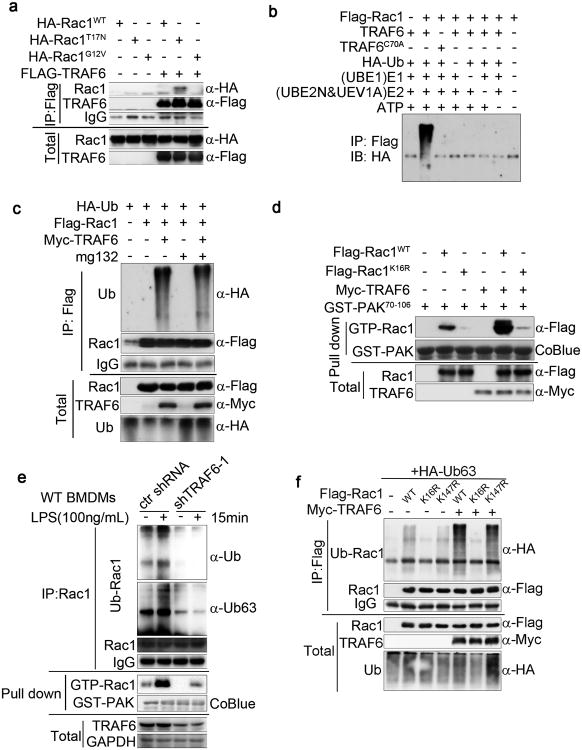
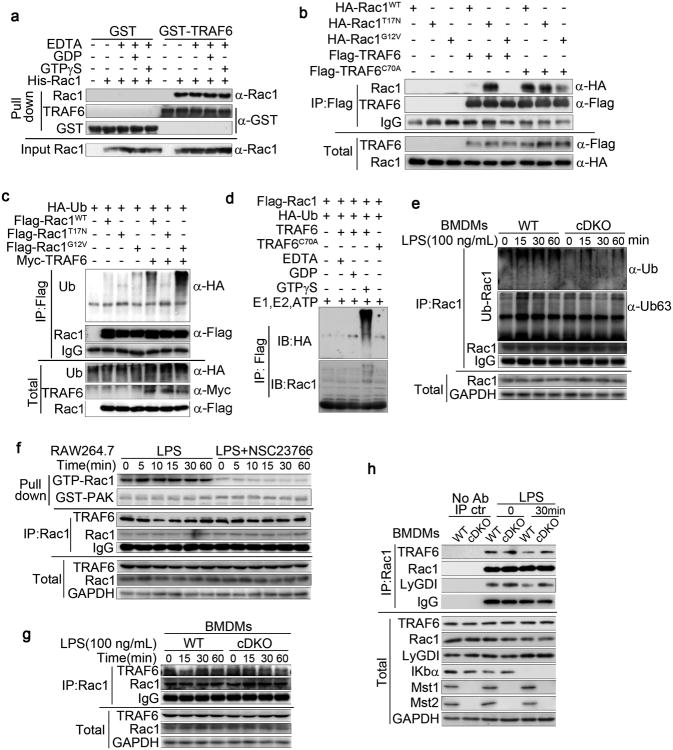
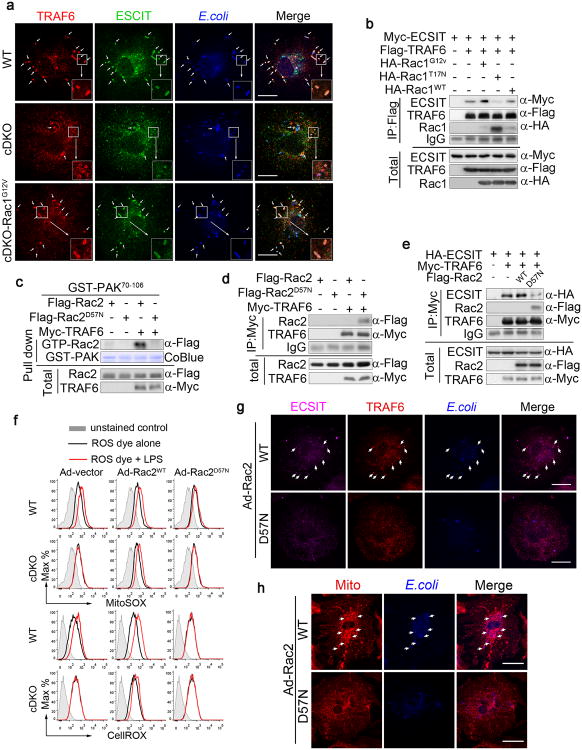
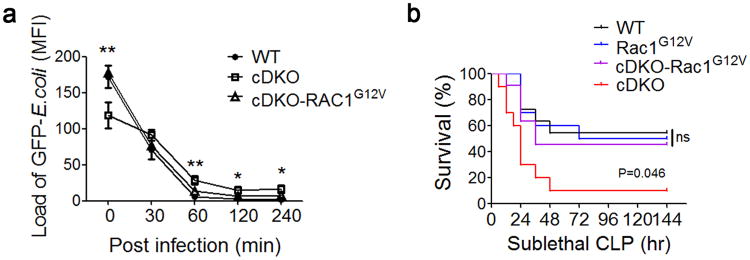
Mitochondria need to be juxtaposed to phagosomes for the synergistic production of ample reactive oxygen species (ROS) in phagocytes to kill pathogens. However, how phagosomes transmit signals to recruit mitochondria has remained unclear. Here we found that the kinases Mst1 and Mst2 functioned to control ROS production by regulating mitochondrial trafficking and mitochondrion-phagosome juxtaposition. Mst1 and Mst2 activated the GTPase Rac to promote Toll-like receptor (TLR)-triggered assembly of the TRAF6-ECSIT complex that is required for the recruitment of mitochondria to phagosomes. Inactive forms of Rac, including the human Rac2(D57N) mutant, disrupted the TRAF6-ECSIT complex by sequestering TRAF6 and substantially diminished ROS production and enhanced susceptibility to bacterial infection. Our findings demonstrate that the TLR-Mst1-Mst2-Rac signaling axis is critical for effective phagosome-mitochondrion function and bactericidal activity.


Figures

Figure 1
Figure 1. Losses of Mst1 and Mst2 increase susceptibility to bacterial sepsis
(a) Representative lung tissues and H&E staining of lung sections from wild type and Mst1−/−Mst2fl/flVav-Cre mice. Scale bar, 100 μm. (b-e) Mst1fl/flMst2fl/fl (WT) or Mst1fl/flMst2fl/flLyz2-Cre (cDKO) mice (n=10 mice per group per experiment) subjected to sublethal CLP; mortality (Mantel–Cox test)(b), serum cytokines measured by ELISAs (c), inflammatory cell infiltration in the lungs as shown by H&E staining (d) and the bacterial loads (colony forming units, CFU) measured in the lung, liver, spleen, kidney and peritoneal fluid (e) after CLP induction. Scale bar, 50 μm. (f) Immunoblot analysis of P-p38, P-Jnk, IκBα and P-Mob1 in WT BMDMs stimulated with indicated TLR agonists for different durations. (g) Immunoblot analysis of P-Mob1 and MyD88 in WT or MyD88 KO RAW246.7 cells stimulated with the indicated agonists for different durations. (h) WT or cDKO BMDMs were stimulated with LPS for the indicated times, followed by immunoblot analysis with the indicated antibodies. (i) WT and cDKO BMDMs or neutrophils were treated with LPS (100 ng/ml) for the indicated times. Cytokine (IL-6 and TNF) production was measured by ELISA. Data were assessed with Student's t-test and are presented as mean ± s.d. ns, no significant, * p<0.05, ** p<0.01, *** p<0.001 compared with respective controls of biological replicates in c (n=3), e (n=5) and i (n=3). Data are one experiment representative of two (e) or three (a-d, f-i) independent experiments with similar results.
Figure 2
Figure 2. Mst1 and Mst2 deficient myeloid cells are defective in bacterial killing and ROS induction
(a) Mst1fl/flMst2fl/fl (WT) and Mst1fl/flMst2fl/flLyz2-Cre (cDKO) BMDMs left uninfected or infected for 10 min at 37°C or 4°C with FITC-labelled E. coli (E. coli-FITC) at a multiplicity of infection (MOI) of 20 or L. monocytogenes (Lm-FITC) at MOI of 10, as analysed by flow cytometry. (b) WT and cDKO BMDMs or neutrophils were infected with L. monocytogenes or E. coli (MOI, 10). CFUs were quantified at the indicated time points. (c, d) WT and cDKO BMDMs infected with GFP-expressing E. coli (GFP-E. coli) for the indicated times were washed, fixed and stained with DAPI. The GFP-E. coli (green) were visualized (c) and quantified (d) by fluorescence microscopy. Scale bar, 20 μm. (e) WT and cDKO BMDMs or neutrophils were stained with MitoSOX (mROS) or CM-H2DCFDA (cellular ROS) for 30 min and analysed by flow cytometry. (f) WT (top panels) or cDKO BMDMs (lower panels) were labeled with CFSE, and then mixed with unlabeled cDKO or WT cells and the CellROX and DAPI coupled E. coli. The phagosomal ROS was visualized by fluorescence microscopy. WT and cDKO cells indicated with stars and arrows respectively. Scale bar, 20 μm. (g) WT and cDKO BMDMs or neutrophils were stimulated with the indicated TLR agonists for 6 h, and mROS production was measured with MitoSOX using flow cytometry. LPS, Lipopolysaccharide; Pam3, Pam3CSK4; LTA, Lipoteichoic acid. (h) mROS and cellular ROS in WT and cDKO BMDMs or neutrophils were measured as described in (e) after E. coli or L. monocytogenes infection. Data were assessed with Student's t test and are represented as mean ± s.d. n=5, biological replicates. * p<0.05, ** p<0.01, *** p<0.001 compared with respective controls or as indicated (b, d). Data are from one experiment representative of two (f) or three (a-e, g, h) independent experiments with similar results.
Figure 3
Figure 3. Mst1 and Mst2 regulate the recruitment of mitochondria to phagosomes via the small GTPase Rac
(a) Mst1fl/flMst2fl/fl (WT), Mst1fl/flMst2fl/flLyz2-Cre (cDKO) and cDKO-Rac1G12V BMDMs were incubated with uncoated, LPS-coated or Pam3CSK4-coated latex beads, and mitochondrial networks (Mito) were immunostained with HSP60 antibodies. Confocal images were acquired. Colocalization of beads (green) and mitochondria (red) are indicated by short arrows. Scale bar, 20 μm. (b) The distribution of mitochondrial networks (HSP60, red) in WT, cDKO, cDKO-Rac1G12V BMDMs and WT BMDMs treated with cytochalasin D or Rac inhibitor NSC23766 after infection with GFP-E. coli (green). Colocalization of E. coli (green) and mitochondria (red) is indicated by arrows. Scale bar, 20 μm. (c) WT, Rac1 G12V, cDKO and cDKO-Rac1G12V BMDMs were treated with DMSO or cytochalasin D and immunostained with F-actin antibodies (green). Scale bar, 20 μm. (d) WT BMDMs and neutrophils were pretreated with DMSO or NSC23766 for 30 min followed by LPS stimulation for 3 h. mROS and cellular ROS were measured by MitoSox red dye and CM-H2DCFDA, respectively, using flow cytometry. (e) Active (GTP-bound) Rac1 levels in WT, cDKO or cDKO-Rac1G12V BMDMs, or in WT and cDKO neutrophils, were detected in GST-PAK70-106 (GST-PAK) with a pull-down assay. GST-PAK protein was stained by Coomassie blue (CoBlue). (f) mROS and cellular ROS in WT, cDKO and cDKO-Rac1G12V BMDMs stimulated with LPS for 3 h were measured by MitoSox and CellRox, respectively, using flow cytometry. Images shown are representative of approximately 100 cells (a, b and c). Data are from one experiment representative of three independent experiments with similar results (a-f).
Figure 4
Figure 4. Mst1 and Mst2 regulate the activation of Rac through PKC-LyGDI
(a) LyGDI and PKCα were identified by mass spectrometry in a Flag-tagged Mst2 pull-down assay using Raw264.7 cell lysates. (b) Co-immunoprecipitation (Co-IP) assay of 293T cells expressing HA-LyGDI and Flag-Mst1, Flag-Mst2 or Flag-PKCα as indicated. Cell lysates were immunoprecipitated with anti-Flag antibody and analysed by immunoblotting with antibodies as indicated. (c) Flag-tagged PKC α, β, γ, δ, ε, η, θ, ι, orζ was co-expressed with HA-Mst2 or HA-Mst2 kinase dead form (KD) in 293T cells. Protein extracts were immunoprecipitated with Flag antibody-conjugated beads and analysed using Phostag SDS-PAGE after treatment with or without calf-intestinal alkaline phosphatase (CIP). (d) Co-IP and Phos-tag analysis (as in c) of 293T cells expressing HA-Mst2 or HA-Mst2 (KD) and Flag-PKCα N-terminal (NT) or Flag-PKCα C-terminal (CT) as indicated. (e) Phos-tag analysis (as in c) in 293T cells expressing Flag-PKCα, Flag-PKCα, (S226A), Flag-PKCα (T228A) or Flag-PKCα (S226A-T228A) and HA-Mst2 as indicated. (f) Immunoblot analysis of P-PKCα (T638) and PKCα in lysates of Mst1fl/flMst2fl/fl (WT) and Mst1fl/flMst2fl/flLyz2-Cre (cDKO) BMDMs stimulated with LPS for the indicated times. (g) Co-IP assay (as in b) of 293T cells expressing HA-LyGDI, Flag-PKCα and Myc-Mst2 as indicated. (h) Co-IP and Phos-tag analysis (as in c) of 293T cells expressing HA-LyGDI, Flag-PKCα, Myc-Mst2 and Myc-Mst2 (KD) as indicated. (i) Co-IP assay (as in b) of 293T cells expressing HA-Rac1, Myc-LyGDI, Flag-PKCα, Flag-Mst2 and Flag-Mst2 (KD) as indicated. Cell lysates were immunoprecipitated with anti-Myc antibody. (j) Endogenous active (GTP-bound) Rac levels in 293T cells expressing Flag-PKCα, Flag-Mst2 and/or Flag-Mst2 (KD) as indicated was detected using an anti-Rac1 antibody in a GST-PAK70-106 (GST-PAK) pull-down assay. (k) Immunoblot analysis of indicated proteins from lysates and immunoprecipitates of WT and cDKO BMDMs treated with LPS for 15 min. Data are from one experiment representative of three independent experiments with similar results (b-k).
Figure 5
Figure 5. TRAF6 positively regulates the Lys63-linked ubiquitination of Rac1 in vitro and in vivo
(a) Strong association of inactive Rac1 with TRAF6. Co-IP assay of 293T cells expressing HA-Rac1WT, HA-Rac1G12V, or HA-Rac1T17N and Flag-TRAF6 as indicated. Cell lysates were immunoprecipitated with anti-Flag antibody and analysed by immunoblotting with antibodies as indicated. (b) In vitro ubiquitylation assay performed with recombinant Rac1, WT TRAF6, or catalytically inactive mutant TRAF6C70A, together with the indicated components. (c) Ubiquitination and Co-IP assay (as in a) of 293T cells expressing Flag-Rac1, Myc-TRAF6 and HA-ubiquitin (Ub) in different combinations as indicated. Cells were treated with DMSO or the proteasome inhibitor MG132. Immunoblotting with anti-HA antibody shows the level of Rac ubiquitylation. (d) Cell lysates of 293T cells expressing Flag-Rac1WT or Flag-Rac1K16R and Myc-TRAF6 as indicated combinations were incubated with GST-PAK70-106 (GST-PAK). The association of active (GTP-bound) Rac1 with GST-PAK70-106 was revealed by Rac1 immunoblotting. GST-PAK70-106 protein was stained by Coomassie blue (CoBlue). (e) Immunoblot analysis of K63-linked polyubiquitin of Rac1 from immunoprecipitates and lysates of WT or TRAF6 knockdown BMDMs treated with LPS for 15 min. (f) TRAF6 mediates the K63-linked polyubiquitin of Rac1 on lysine 16 residues. Immunoblotting assays show Rac1 ubiquitination in 293T cells expressing Flag-Rac1WT, Flag-Rac1K16R or Flag-Rac1K147R and Myc-TRAF6 as indicated. Data are from one experiment representative of three independent experiments with similar results (a-f).
Figure 6
Figure 6. TRAF6 maintains a Rac1 activation state via Lys63-linked ubiquitination
(a) Direct association of TRAF6 and Rac1 in vitro (pull-down). Beads coupled to GST or GST-TRAF6 were incubated with recombinant purified His-Rac1, the Mg2+-free form of Rac1 (EDTA), or Rac1 loaded with GDP or GTPγS, as indicated. The HECT E3 ubiquitin ligase (HACE1)-associated Rac1 (top: Rac1) and input Rac1 (bottom) were determined by Rac1 immunoblotting. (b) The association of TRAF6C70A with Rac1WT, Rac1T17N or Rac1G12V. Co-IP assay of 293T cells expressing HA-Rac1WT, HA-Rac1G12V, or HA-Rac1T17N and Flag-TRAF6 or Flag-TRAF6C70A as indicated. Cell lysates were immunoprecipitated with anti-Flag antibody and analysed by immunoblotting with antibodies as indicated. (c) The preferential ubiquitination of active Rac1 by TRAF6 in 293T cells. Ubiquitination and co-IP assay (as in b) of 293T cells expressing Flag-Rac1WT, Flag-Rac1G12V, or Flag-Rac1T17N and/or Myc-TRAF6 as indicated. (d) GTP-dependent ubiquitination of Rac1 by TRAF6 in vitro. Recombinant Rac1 loaded with GTPγS, GDP or the Mg2+-free form (EDTA) was used in the ubiquitination reaction. (e) Immunoblot analysis of Rac1 ubiquitination in the lysates and immunoprecipitates of Mst1fl/flMst2fl/fl (WT) and Mst1fl/flMst2fl/flLyz2-Cre (cDKO) BMDMs upon LPS treatment. (f, g) LPS treatment enhanced the activity of Rac1 and decreased the association of TRAF6 and Rac1 in Raw264.7 cells (e) and BMDMs (f). The Rac1 inhibitor (NSC23766) (e) or Mst1/2 deletion (f) recovered the association of TRAF6 and Rac1 upon LPS treatment. (h) The association of Rac1, TRAF6 and LyGDI was decreased in WT BMDMs but enhanced in cDKO BMDMs upon LPS stimulation. Data are from one experiment representative of three independent experiments with similar results (a-h).
Figure 7
Figure 7. Rac modulates the assembly of the TRAF6-ECSIT complex for the juxtaposition of mitochondria and phagosomes
(a) The immunofluorescence staining shows the co-localization of TRAF6 (red) and ECSIT (green) with the bacteria in Mst1fl/flMst2fl/fl (WT) and Mst1fl/flMst2fl/flLyz2-Cre-Rac1G12V (cDKO-Rac1G12V) BMDMs but not in cDKO BMDMs when infected with E. coli. Scale bar, 20 μm. (b) Co-IP assay of 293T cells expressing Myc-ECSIT, Flag-TRAF6 and HA-Rac1WT, HA-Rac1G12V, or HA-Rac1T17N as indicated. Cell lysates were immunoprecipitated with anti-Flag antibody and analysed by immunoblotting with antibodies as indicated. (c) Cell lysates of 293T cells expressing Flag-Rac2WT or Flag-Rac2D57N and Myc-TRAF6 as indicated were incubated with GST-PAK70-106 (GST-PAK). The association of active (GTP-bound) Rac2 with GST-PAK70-106 was revealed by Rac2 immunoblotting. GST-PAK70-106 protein was stained by Coomassie blue (CoBlue). (d) Association of inactive Rac2D57N with TRAF6. Co-IP assay (as in b) of 293T cells expressing HA-Rac2WT, HA-Rac2D57N and Flag-TRAF6 as indicated. (e) Competitive binding of ECIST and Rac2D57N with TRAF6. Co-IP assay (as in b) of 293T cells expressing Myc-ECSIT, Flag-TRAF6 and HA-Rac2WT or HA-Rac2D57N as indicated. (f) WT and cDKO BMDMs were infected with adenoviruses expressing control vector, Rac2WT or Rac2D57N, then treated with LPS for 3 h. mROS and cellular ROS were measured by MitoSOX (mROS) and CellROX (cellular ROS), respectively, using flow cytometry. (g, h) WT BMDMs infected with adenoviruses expressing Rac2WT or Rac2D57N were incubated with E. coli. Immunofluorescence staining shows the co-localization of ECSIT (purple) and TRAF6 (red) and with the bacteria (blue) (g), as well as the mitochondrial networks (Mito) (HSP60, red) with the bacteria (blue) (h), in Rac2WT- but not Rac257N-infected BMDMs, as indicated by arrows. Scale bar, 20 μm. Images shown are representative of approximately 100 cells (a, g, h). Data are from one experiment representative of three independent experiments with similar results (a-h).
Figure 8
Figure 8. Rac1G12V knock-in fully rescues the Mst1/2-deficient phenotype
(a) Mst1fl/flMst2fl/fl (WT), Mst1fl/flMst2fl/flLyz2-Cre (cDKO) and cDKO-Rac1G12V BMDMs were infected with GFP-E. coli for the indicated times and the GFP-E. coli was quantified by fluorescence microscopy. Data were assessed with Student's t test and are represented as mean ± s.d. n=5. * p<0.05, ** p<0.01 in a comparison of cDKO and cDKO-Rac1G12V groups. (b) Mortality of WT (n=11), Rac1G12V (n=10), cDKO (n=10) or cDKO-Rac1G12V (n=11) mice subjected to sublethal CLP. The Mantel–Cox test, p=0.046 compared between cDKO and cDKO-Rac1G12V groups. Data are from one experiment representative of three independent experiments with similar results (a, b).

Comment in

Similar articles

Cited by

References

    1. West AP, Koblansky AA, Ghosh S. Recognition and signaling by toll-like receptors. Annual review of cell and developmental biology. 2006;22:409–437. - PubMed
    1. Beutler B, et al. Genetic analysis of host resistance: Toll-like receptor signaling and immunity at large. Annual review of immunology. 2006;24:353–389. - PubMed
    1. Lambeth JD. NOX enzymes and the biology of reactive oxygen. Nature reviews Immunology. 2004;4:181–189. - PubMed
    1. Bedard K, Krause KH. The NOX family of ROS-generating NADPH oxidases: physiology and pathophysiology. Physiological reviews. 2007;87:245–313. - PubMed
    1. Bokoch GM, Diebold BA. Current molecular models for NADPH oxidase regulation by Rac GTPase. Blood. 2002;100:2692–2696. - PubMed

Publication types

MeSH terms

Substances