. 2015 Dec;45(12):1856-67.
doi: 10.1111/cea.12643.

Different Bla-g T cell antigens dominate responses in asthma versus rhinitis subjects

Affiliations

Different Bla-g T cell antigens dominate responses in asthma versus rhinitis subjects

M B C Dillon et al. Clin Exp Allergy. 2015 Dec.

Abstract

Background and objective: The allergenicity of several German cockroach (Bla-g) antigens at the level of IgE responses is well established. However, less is known about the specificity of CD4+ TH responses, and whether differences exist in associated magnitude or cytokine profiles as a function of disease severity.

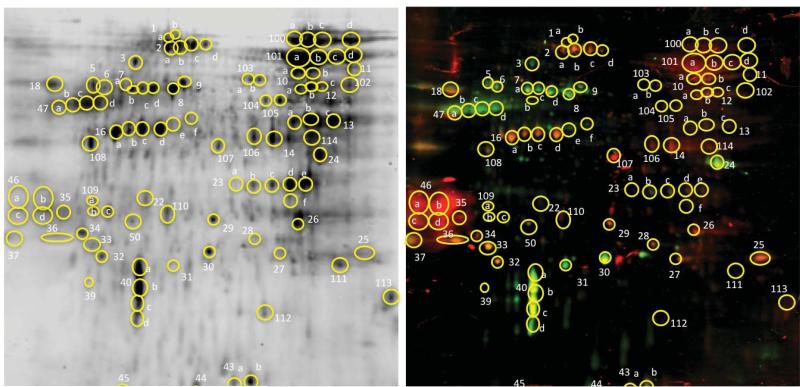
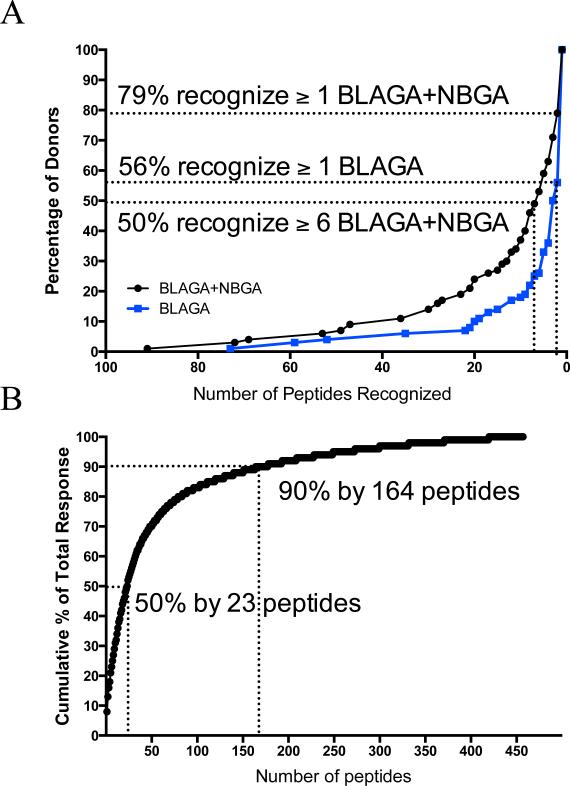
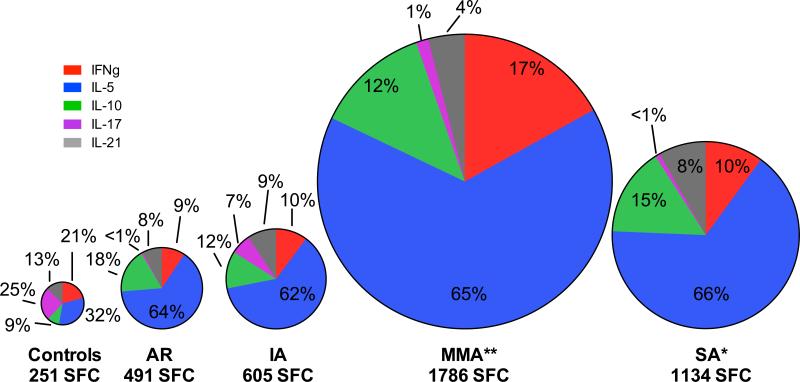
Methods: Proteomic and transcriptomic techniques were used to identify novel antigens recognized by allergen-specific T cells. To characterize different TH functionalities of allergen-specific T cells, ELISPOT assays with sets of overlapping peptides covering the sequences of known allergens and novel antigens were employed to measure release of IL-5, IFNγ, IL-10, IL-17 and IL-21.

Results: Using these techniques, we characterized TH responses in a cohort of adult Bla-g-sensitized subjects, either with (n = 55) or without (n = 17) asthma, and nonsensitized controls (n = 20). T cell responses were detected for ten known Bla-g allergens and an additional ten novel Bla-g antigens, representing in total a 5-fold increase in the number of antigens demonstrated to be targeted by allergen-specific T cells. Responses of sensitized individuals regardless of asthma status were predominantly TH 2, but higher in patients with diagnosed asthma. In asthmatic subjects, Bla-g 5, 9 and 11 were immunodominant, while, in contrast, nonasthmatic-sensitized subjects responded mostly to Bla-g 5 and 4 and the novel antigen NBGA5.

Conclusions: Asthmatic and nonasthmatic cockroach-sensitized individuals exhibit similar TH 2-polarized responses. Compared with nonasthmatics, however, asthmatic individuals have responses of higher magnitude and different allergen specificity.

Keywords: CD4+ T cell; asthma; cockroach allergy; epitope.


Figures

Figure 1
Figure 1. CD4+ T Cell Reactivity to Known Bla-g Allergens (BLAGA)
A) Overall responses (sum of peptide and cytokine responses) after stimulation with BLAGA peptides. B) Overall responses to individual BLAGA. C) Pattern of cytokine responses to BLAGA. Geometric means and 95% confidence intervals shown. Black circles represent Bla-g sensitized subjects, and gray open circles represent non-sensitized controls. *p≤0.05, **p≤0.005 by non-parametric Mann-Whitney t-test. Dotted lines at 20 SFC indicates lower limit of assay detection. We consider 20 SFC/106 PBMC as an operational lower limit of detection in our ELISPOT assay, and is thus used as the “negative” value for donor response, where a lower limit value is required for graphical or statistical purposes. Each symbol represents the response from an individual subject.
Figure 2
Figure 2. Identification of Novel Bla-g antigens (NBGA) by 2-D Gel Immunoblot
A) Coomassie stain of 2-D gel of Bla-g extract. B) Bla-g extract stained with pooled sera of Bla-g sensitized subjects. Green spots indicate IgE binding; red spots indicate IgG binding; and yellow spots indicate dual IgE/IgG binding. Yellow circles indicate sections selected for proteomic analysis.
Figure 3
Figure 3. CD4+ T Cell Reactivity to Novel Bla-g Antigens (NBGA)
A) Individual NBGA responses (sum of all cytokines) of Bla-g sensitized and control subjects after stimulation with NBGA peptides. B) Pattern of cytokine responses detected against IgE-reactive and non-IgE-reactive NBGA in sensitized and control subjects. Geometric means and 95% confidence intervals are shown. ****p<0.0001,***p<0.001,**p<0.01, by non-parametric Mann-Whitney t-test. Dotted lines at 20 SFC indicates lower limit of assay detection. We consider 20 SFC/106 PBMC as an operational lower limit of detection in our ELISPOT assay, and is thus used as the “negative” value for donor response, where a lower limit value is required for graphical or statistical purposes. Each symbol represents the response from an individual subject. NBGA antigens are classified as IgE+ or IgE− based on the gels shown in Figure 2 and as described in the results
Figure 4
Figure 4. Immunodominance of Bla-g Epitopes
A) Comparison of the percentage of the total cytokine response per epitope. BLAGA represented by blue circles. Combined BLAGA and NBGA represented by black circles. B) Comparison of the number of epitopes recognized per subject among the Bla-g sensitive subjects.
Figure 5
Figure 5. Changing Magnitude and Polyfunctionality of Responses Among Asthma Severities
Diameter of pie chart is proportional to geometric mean of the total sum of responses for subject group. Values indicated are percentage of total response encompassed by individual cytokine. Red denotes relative proportion of IFNγ responses, blue IL-5, green IL-10, purple, IL-17, and gray IL-21. *p<0.05, **p<0.005, calculated by non-parametric Mann-Whitney t-test.
Figure 6
Figure 6. Differential Immunodominance of Bla-g Antigens as a Function of Allergic Clinical Status
Percentage response accounted by individual antigens of total cytokine response to all Bla-g Antigens for (A) Control, (B) Allergic Rhinitis, and (C) Asthmatic Sensitized subjects. “Other” category encompasses antigens accounting individually for <1% of total response for all three groups.
Figure 7
Figure 7. Epitope Sets Reactivity as Function of Asthma Status
Response to epitope set as a percentage of total response for (A) Asthmatic and (B) AR after stimulation with epitope pools following culture with Bla-g extract with corresponding magnitudes of response (in SFC per 106 PBMC) to each pool (C-D). Bars indicate median values (A-B) or geometric means (C-D). Each symbol represents the response from an individual subject.

References

    1. Kanchongkittiphon W, Mendell MJ, Gaffin JM, Wang G, Phipatanakul W. Indoor Environmental Exposures and Exacerbation of Asthma: An Update to the 2000 Review by the Institute of Medicine. Environ Health Perspect. 2014 Oct 10; - PMC - PubMed
    1. Camelo-Nunes IC, Solé D. Cockroach allergy: risk factor for asthma severity. J Pediatr (Rio J) 2006 Sep;82(5):398–9–authorreply399–400. - PubMed
    1. Rosenstreich DL, Eggleston P, Kattan M, Baker D, Slavin RG, Gergen P, et al. The role of cockroach allergy and exposure to cockroach allergen in causing morbidity among inner-city children with asthma. N Engl J Med. 1997 May 8;336(19):1356–63. - PubMed
    1. Busse PJ, Wang JJ, Halm EA. Allergen sensitization evaluation and allergen avoidance education in an inner-city adult cohort with persistent asthma. J Allergy Clin Immunol. 2005 Jul;116(1):146–52. - PubMed
    1. Wood RA, Togias A, Wildfire J, Visness CM, Matsui EC, Gruchalla R, et al. Development of cockroach immunotherapy by the Inner-City Asthma Consortium. J Allergy Clin Immunol. 2014 Mar;133(3):846–6. - PMC - PubMed

Publication types

MeSH terms