. 2015 Oct 6;6(30):28646-60.
doi: 10.18632/oncotarget.5796.

A genome wide transcriptional model of the complex response to pre-TCR signalling during thymocyte differentiation

Affiliations

A genome wide transcriptional model of the complex response to pre-TCR signalling during thymocyte differentiation

Hemant Sahni et al. Oncotarget. .

Abstract

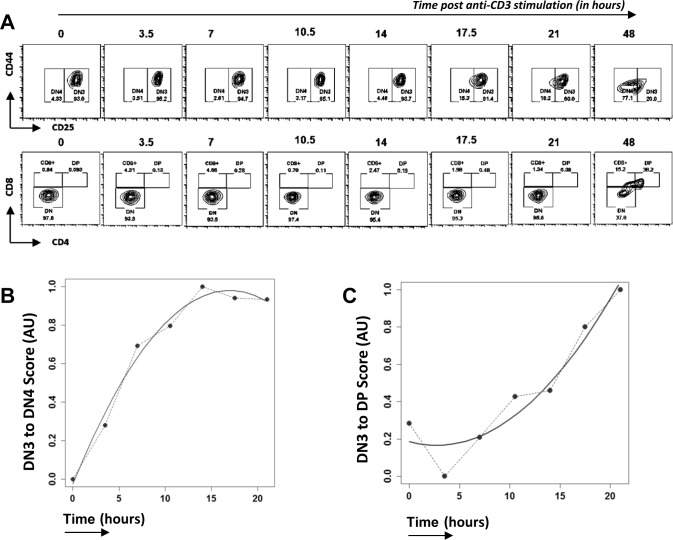
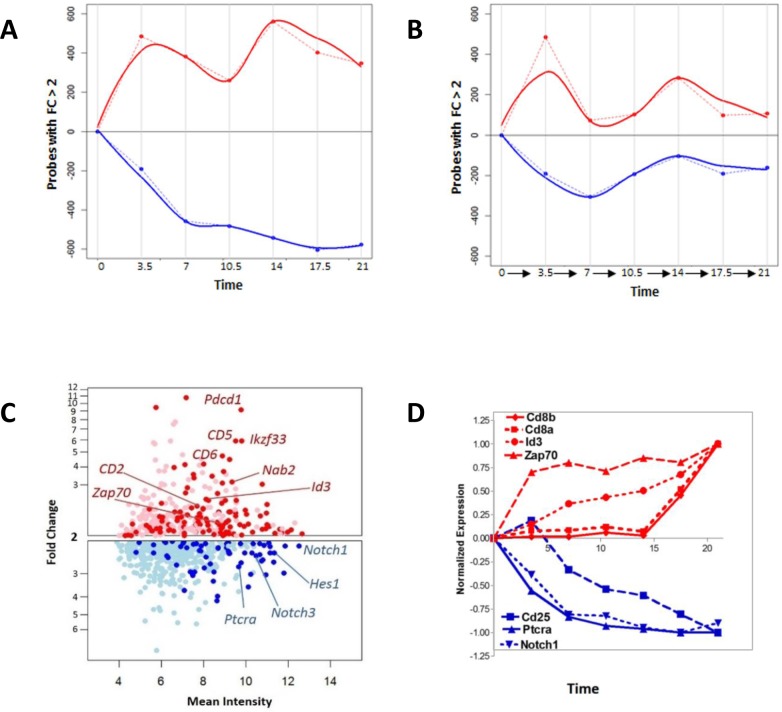
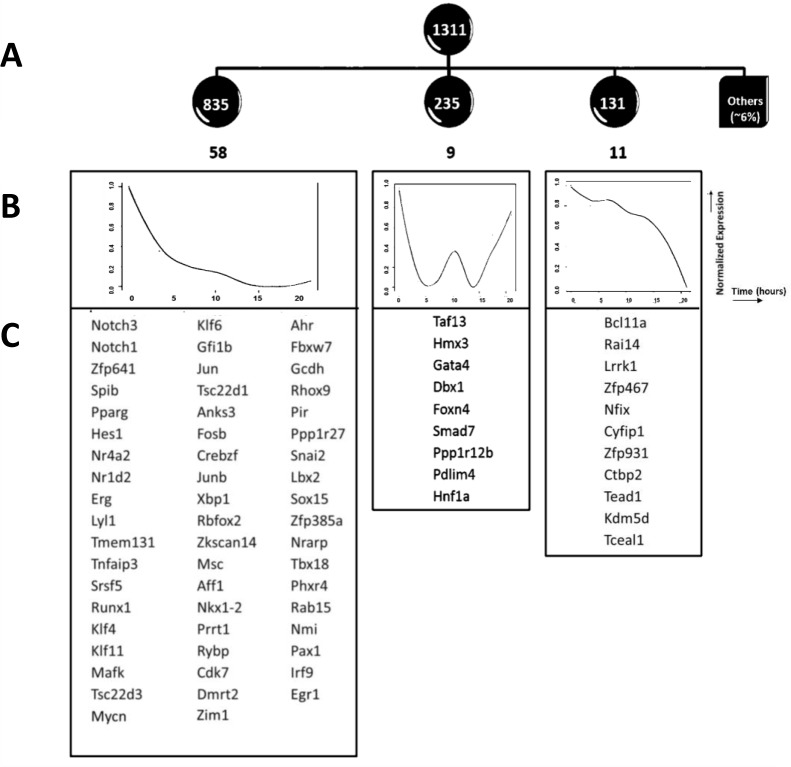
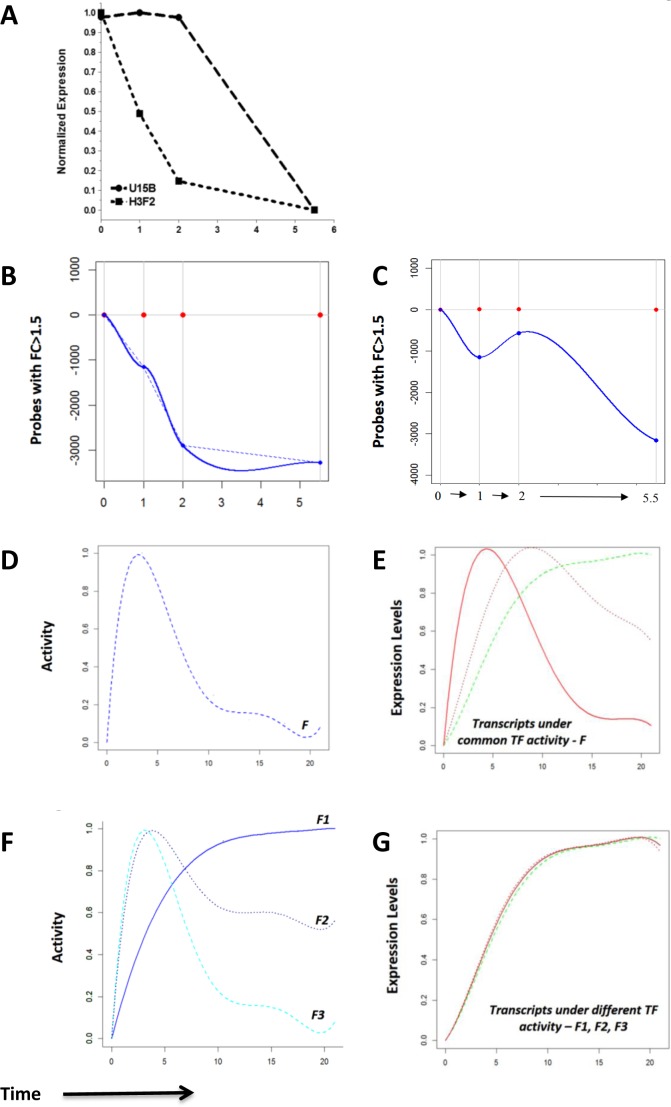
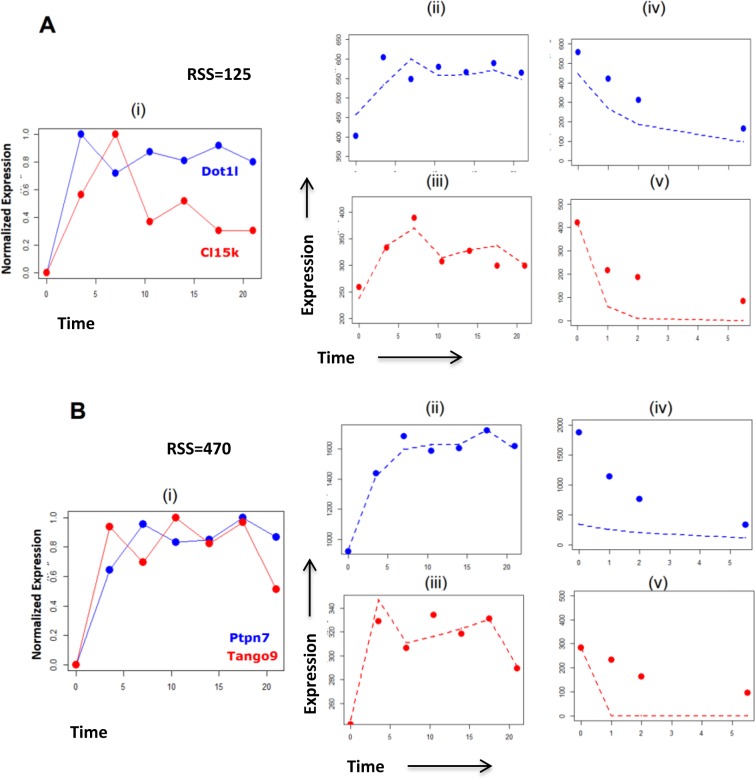
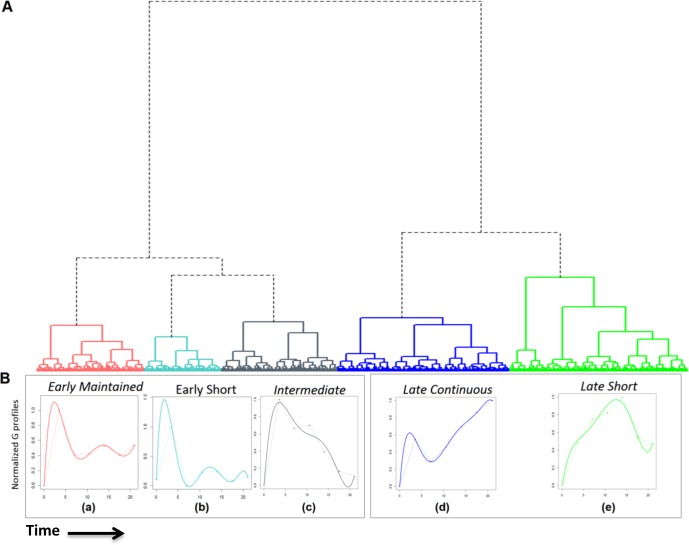
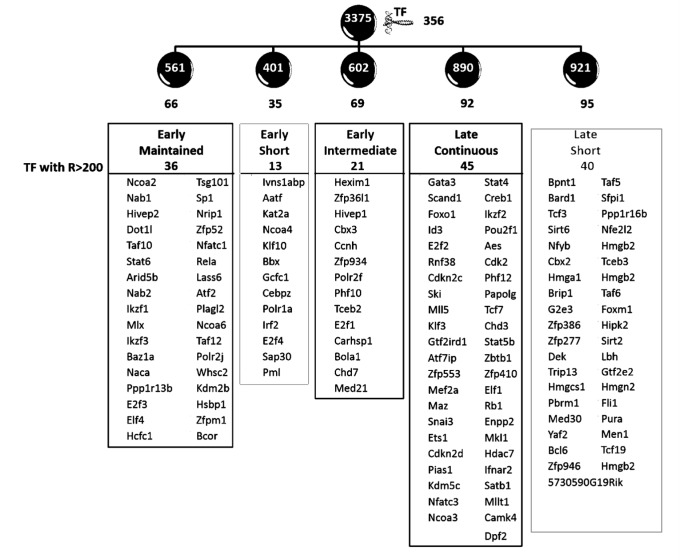
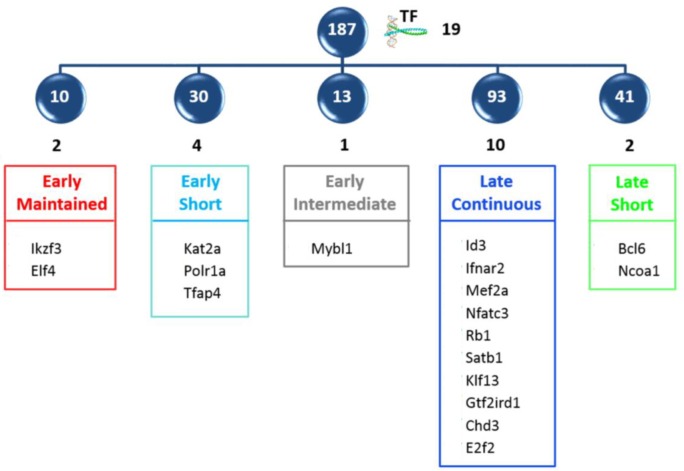
Developing thymocytes require pre-TCR signalling to differentiate from CD4-CD8- double negative to CD4+CD8+ double positive cell. Here we followed the transcriptional response to pre-TCR signalling in a synchronised population of differentiating double negative thymocytes. This time series analysis revealed a complex transcriptional response, in which thousands of genes were up and down-regulated before changes in cell surface phenotype were detected. Genome-wide measurement of RNA degradation of individual genes showed great heterogeneity in the rate of degradation between different genes. We therefore used time course expression and degradation data and a genome wide transcriptional modelling (GWTM) strategy to model the transcriptional response of genes up-regulated on pre-TCR signal transduction. This analysis revealed five major temporally distinct transcriptional activities that up regulate transcription through time, whereas down-regulation of expression occurred in three waves. Our model thus placed known regulators in a temporal perspective, and in addition identified novel candidate regulators of thymocyte differentiation.

Keywords: DP; Immune response; Immunity; Immunology Section; foetal thymic organ cultures; genome wide transcriptional modelling; pre-TCR; thymus.


Conflict of interest statement

CONFLICTS OF INTEREST

The authors have no conflicts of interest.

Figures

Figure 1
Figure 1. Time course analysis of transcriptional changes in Rag1−/− FTOC on anti-CD3 treatment
A. Differentiation of thymocytes from E17.5 Rag1−/− embryos in FTOCs after anti-CD3ε stimulation analysed by flow cytometry through time, at time points stated. Contour plots show staining for CD44 and CD25 on cells gated to be CD4CD8(upper panel) and staining for CD4 and CD8 (lower panel). Th1.2+ cells were purified from these cultures at the time points shown, RNA extracted, and gene expression measured by microarray. B. and C. Cannonical Correspondence Analysis (CCA) of the transcriptome of anti-CD3 treated Rag1−/− thymocytes through time (in hours): B. plotted against a scale of DN3 to DN4, generated from transcriptome data from sorted DN3 and DN4 thymocytes from the Immgen database; C. plotted on a scale of DN3 to DP generated from transcriptome data from sorted DN3 and DP thymocytes from the Immgen database. Dotted lines join the values at each time point, and solid lines show the best fitting curve.
Figure 2
Figure 2. The pre-TCR initiates a complex molecular response
A. Number of genes with fold change >2 with respect to time zero, plotted through the time course of the experiment, showing up- and down-regulated genes. The number of up-regulated genes are shown in red, and are shown graphically in the positive half of the x-axis, whereas the number of down-regulated genes are shown in blue, and are illustrated graphically in the negative half of the x-axis. Dotted lines join the values at each time point, and solid lines show the best fitting curve. B. Number of genes with fold change >2 at transitions between successive measurements. The number of up-regulated genes between successive measurements are shown in red, and are shown graphically in the positive half of the x-axis, whereas the number of down-regulated genes between successive measurements are shown in blue, and are illustrated graphically in the negative half of the x-axis. Dotted lines join the values at each time point, and solid lines show the best fitting curve. C. Genes with fold change >2 with respect to time zero at seven hours after anti-CD3 stimulation. Selected genes have been marked on the plot. Up-regulated genes are shown in red, and down-regulated genes are shown in blue. Light red and light blue dots represent those not annotated to any gene on the current Affymetrix 1.0 ST definitions. D. The expression pattern of selected transcripts through time in the experiment. Up-regulated genes are shown in red, and down-regulated genes are shown in blue.
Figure 3
Figure 3. Down regulation of expression of genes following pre-TCR signal transduction
A. Expression based analysis of down-regulated genes. Clustering was performed on expression profiles of 1311 down-regulated genes, which fell into three groups. The number of genes in each group is given in white, within the dark circles, and the number of transcription factors in each group is given in black, below the circles. B. The normalized mean expression profiles for each of the three clusters are shown as graphs, with normalised expression plotted against time. C. Transcription factors that fell within the down-regulated clusters are listed.
Figure 4
Figure 4. Measurement of transcript degradation and influence of degradation on interpretation of expression data
A.-C. Genome-wide RNA degradation was measured by microarray at stated time points after addition of Actinomycin D to Rag1−/− FTOC after 10 hours of anti-CD3 stimulation. Time zero represents the time of addition of Actinomycin D, and time is shown on the x-axis in all plots. A. The decay pattern of transcripts U15b and H3f2 through time in the degradation dataset. B. The number of transcripts with fold change >1.5 with respect to time zero in the degradation dataset, shown in the negative part of the x-axis to graphically illustrate down-regulation. C. The number of probes with fold change >1.5 at transitions between successive measurements in the degradation dataset, shown in the negative part of the x-axis to graphically illustrate down-regulation. D.-G. The hypothetical effects of transcript degradation on modelling transcriptional activities, illustrated graphically. D. The activity profile, F, of a hypothetical transcription factor with E. the corresponding normalized responses of three hypothetical target gene transcripts (green, brown and red) with increasing degradation rates. At a higher degradation rate (0.95 for red), the initial response and the subsequent decay are quick such that the transcript expression profile closely resembles the profile of the activity it is driven under. In contrast, transcripts with smaller rates of degradation (0.02 for green, 0.15 for brown) show expression profiles that are delayed. F. Three different hypothetical activity profiles, F1, F2 and F3 of different transcription factors with G. the expression profiles of their hypothetical corresponding targets, in red, brown and green respectively. The variations in degradation rates of these transcripts (0.95 for red, 0.15 for brown, and 0.02 for green) influence the shapes of their net expression profiles such that all the shapes are highly correlated with each. This can be misleading in cases of clustering solely on expression, and can lead to the false assumption that the transcripts are under one common transcriptional activity.
Figure 5
Figure 5. Visualization of the effects of rate of RNA degradation on modelling transcriptional activites, giving examples of specific genes
A. Known targets of transcription factor E2F4 activity, Dot1l and Cl15k, display expression profiles (i) which have low correlation. The consideration of the expression data (ii, iii) with the degradation data (iv,v) of both genes simultaneously by GWTM shows a relatively low RSS of 125. This suggests that it is likely that both genes are driven by the same transcriptional activity, since Cl15k shows a much higher degradation rate than Dot1l, leading to the differences in their expression profiles. B. Two transcripts Ptpn7 and Tango9 showed highly correlated expression profiles (i). However, on consideration of their expression (ii, iii) and degradation (iv, v) profiles simultaneously by GWTM, it is clear that both transcripts are unlikely to be driven under the same transcriptional activity as the pair has a high RSS of 470. Thus, the high rate of degradation of Ptpn7 compared to Tango9, makes it unlikely that both genes will fall under the same transcription regulatory activity, despite displaying similar expression profiles. Dashed lines represent the corresponding values obtained by GWTM using optimized parameters for expression and degradation.
Figure 6
Figure 6. Genome wide transcriptional modelling reveals five principal groups of genes that are up regulated by pre-TCR signal transduction
A. There are five principal transcriptional activities downstream of the pre-TCR signal. RSS were calculated, followed by hierarchical clustering by Ward's minimum variance method using square root RSS as the distance measure. The resulting cluster dendrogram is composed of five principal transcriptional clusters (a-e) obtained under two major transcriptional responses. B. Compound production values, G, were calculated for all genes. The normalized mean G profiles for each of the five clusters are shown to visualise the transcriptional activity profile. Dotted lines join the calculated points and coloured lines show the best fitting curve.
Figure 7
Figure 7. Transcription factors affected by the principal transcriptional activities
The figure shows that the 3375 transcripts modelled using GWTM clustered into five clusters of 561, 401, 602, 890 and 921 genes, named ‘early maintained’, ‘early short’, ‘early intermediate’, ‘late continuous’ and ‘late short’ clusters respectively. Within each of these clusters controlled by the five principal transcriptional activities were transcription factors (TFs), the numbers for which are shown in black. The transcription factors varying with a range (R) >200 units (non-log RMA) in each of the five clusters are shown.
Figure 8
Figure 8. Intersection of modelled transcription factors with high scoring CCA genes
The intersection of the 356 transcription factors with the top 1000 genes of the expression dataset contributing to the DN3->DP CCA score, revealed 19 important transcription factors, which are shown distributed between the five principle clusters.

References

    1. Koch U, Radtke F. Mechanisms of T cell development and transformation. Annual review of cell and developmental biology. 2011;27:539–562. - PubMed
    1. Shah DK, Zuniga-Pflucker JC. An Overview of the Intrathymic Intricacies of T Cell Development. Journal of Immunology. 2014;192:4017–4023. - PubMed
    1. Godfrey DI, Kennedy J, Suda T, Zlotnik A. A developmental pathway involving four phenotypically and functionally distinct subsets of CD3−CD4−CD8− triplenegative adult mouse thymocytes defined by CD44 and CD25 expression. Journal of immunology. 1993;150:4244–4252. - PubMed
    1. Radtke F, Wilson A, Stark G, Bauer M, van Meerwijk J, MacDonald HR, Aguet M. Deficient T cell fate specification in mice with an induced inactivation of Notch1. Immunity. 1999;10:547–558. - PubMed
    1. Pui JC, Allman D, Xu L, DeRocco S, Karnell FG, Bakkour S, Lee JY, Kadesch T, Hardy RR, Aster JC, Pear WS. Notch1 expression in early lymphopoiesis influences B versus T lineage determination. Immunity. 1999;11:299–308. - PubMed

Publication types

MeSH terms

Associated data