. 2015 Oct;146(4):323-40.
doi: 10.1085/jgp.201511478.

A chimeric prokaryotic pentameric ligand-gated channel reveals distinct pathways of activation

Affiliations

A chimeric prokaryotic pentameric ligand-gated channel reveals distinct pathways of activation

Nicolaus Schmandt et al. J Gen Physiol. 2015 Oct.

Abstract

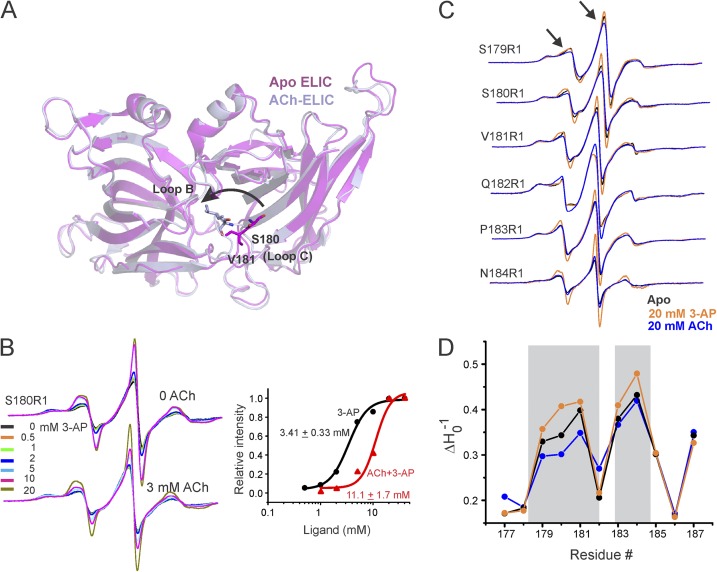
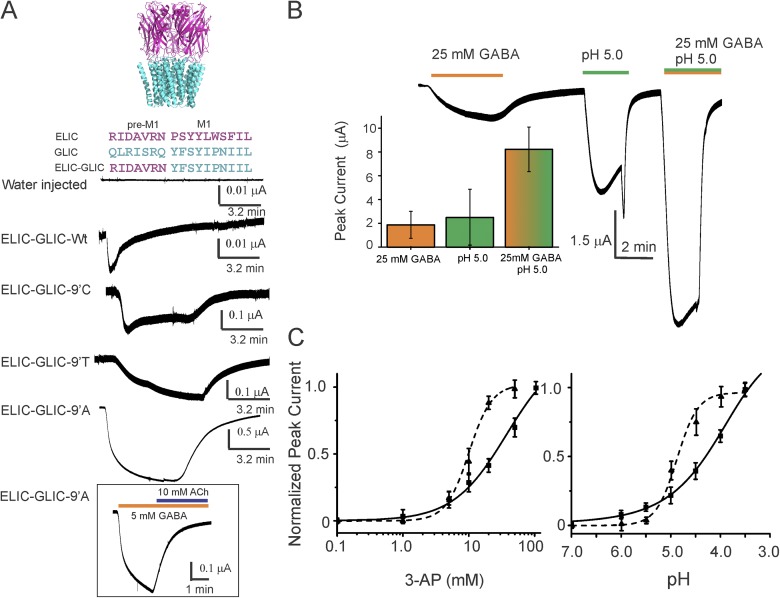
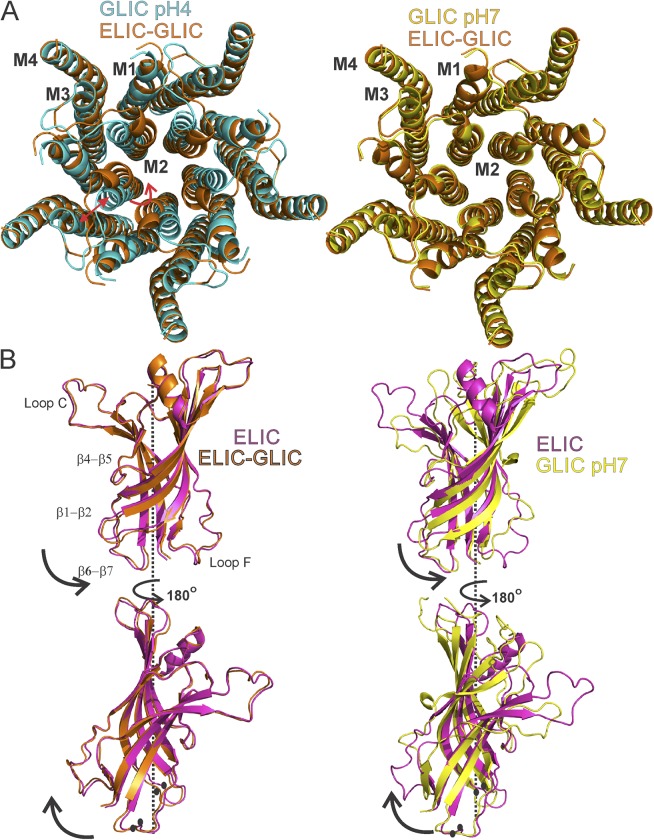
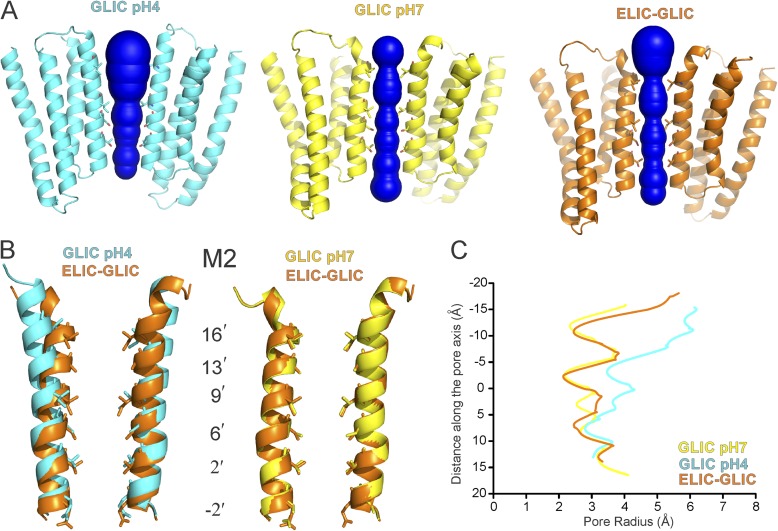
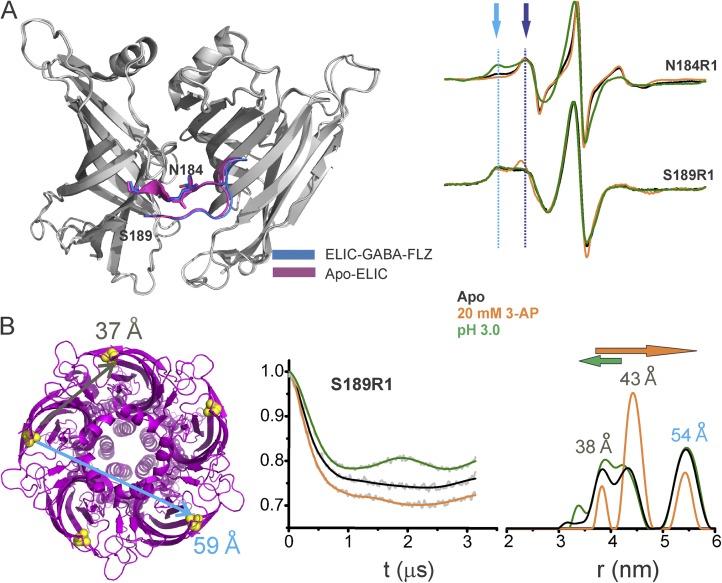
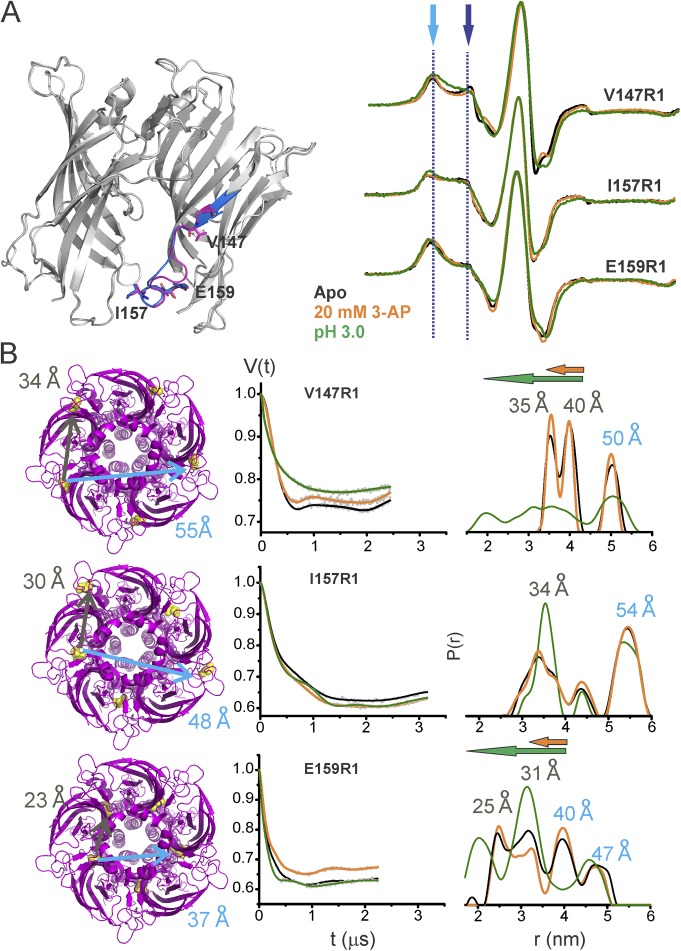
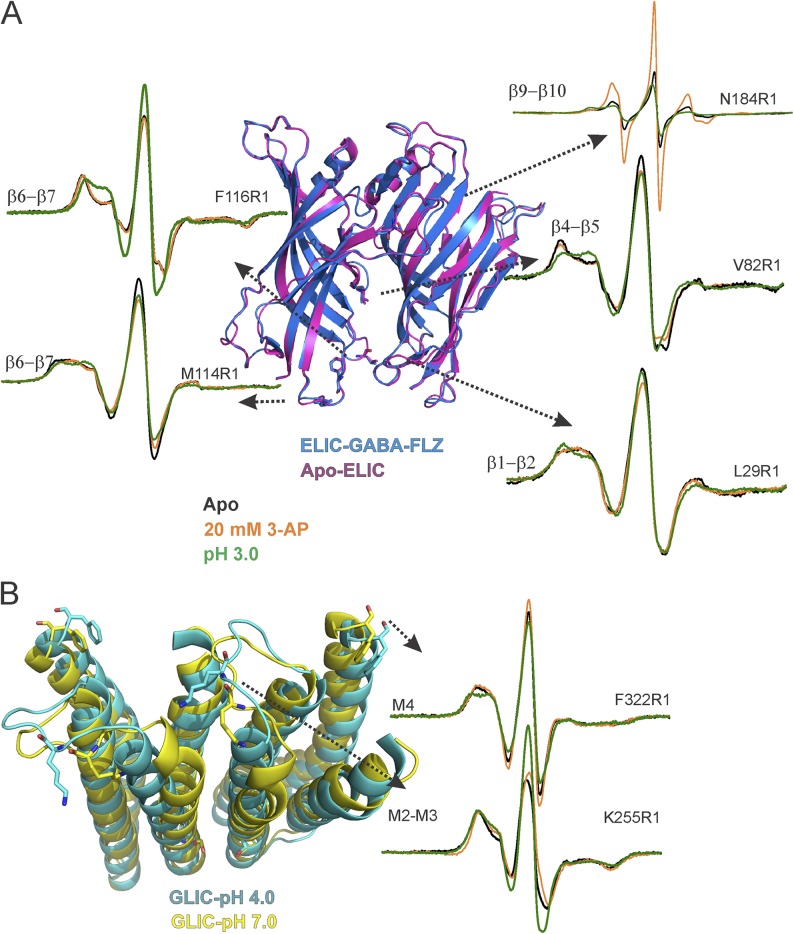
Recent high resolution structures of several pentameric ligand-gated ion channels have provided unprecedented details of their molecular architecture. However, the conformational dynamics and structural rearrangements that underlie gating and allosteric modulation remain poorly understood. We used a combination of electrophysiology, double electron-electron resonance (DEER) spectroscopy, and x-ray crystallography to investigate activation mechanisms in a novel functional chimera with the extracellular domain (ECD) of amine-gated Erwinia chrysanthemi ligand-gated ion channel, which is activated by primary amines, and the transmembrane domain of Gloeobacter violaceus ligand-gated ion channel, which is activated by protons. We found that the chimera was independently gated by primary amines and by protons. The crystal structure of the chimera in its resting state, at pH 7.0 and in the absence of primary amines, revealed a closed-pore conformation and an ECD that is twisted with respect to the transmembrane region. Amine- and pH-induced conformational changes measured by DEER spectroscopy showed that the chimera exhibits a dual mode of gating that preserves the distinct conformational changes of the parent channels. Collectively, our findings shed light on both conserved and divergent features of gating mechanisms in this class of channels, and will facilitate the design of better allosteric modulators.


Figures

Figure 1.
Figure 1.
Agonist- and antagonist-evoked conformational changes in the ELIC-ECD. (A) Superimposition of apo-ELIC (PDB accession no. 3RQU) and ACh-ELIC (PDB accession no. 3RQW) structures shows an inward (counterclockwise) motion of loop C. (B) Concentration-dependent changes in the EPR line shape and amplitude measured at position Ser180 in the presence and absence of 3 mM ACh. In each case, the spectra are normalized to the total number of spin (see Materials and methods). A plot of peak amplitude (of the central line) as a functional 3-AP concentration (right). (C) Spin-normalized CW-EPR spectra of representative loop C residues in apo state and in the presence of ACh or 3-AP. (D) Changes in probe mobility of loop C positions in the three conditions. The gray boxes highlight regions displaying prominent changes.
Figure 2.
Figure 2.
Functional characterization of the ELIC-GLIC chimera. (A) A schematic representation of the chimera based on GLIC (PDB accession no. 4HFI) and ELIC (PDB accession no. 3RQU) structures, and the sequence alignment highlighting the region where the ELIC-ECD was fused to the GLIC-TMD (top). Agonist-induced (25 mM 3-AP) 13-min current response in oocytes measured by two-electrode voltage clamp (bottom). Inset shows (B) current traces for the chimera 9′Ala mutant in response to activation by acid (pH 5.0), agonist (25 mM GABA), and a combination of both. The plot shows peak response for the three conditions. The error bars denote standard deviation (n = 3). (C) Dose–response curves for the 9′Ala mutant (solid line) in the presence of 3-AP (dashed line, compared with ELIC) or acid (dashed line, comparison with GLIC). Currents are expressed as a fraction of the maximal response. The error bars denote standard deviation (n > 5). The EC50 (3-AP) and pH50 values are 32.8 ± 9.1 mM and 4.22 ± 0.11, and the corresponding Hill coefficients are 1.1 ± 0.2 and 9.1 ± 2.1, respectively. The EC50 (3-AP) and Hill coefficient for WT ELIC are 10.02 ± 0.05 mM and 2.5 ± 0.3. The EC50 (pH) and Hill coefficient for WT GLIC are 4.89 ± 0.06 mM and 2.0 ± 0.1. The error bars for WT denote standard deviation (n > 3).
Figure 3.
Figure 3.
Structural differences in the ELIC-GLIC chimera compared with ELIC and GLIC. (A) Top view of TMDs comparing the ELIC-GLIC chimera with GLIC structures in the closed (pH 7.0; PDB accession no. 4NPQ) and open (pH 4.0; PDB accession no. 4HFI) forms. Red arrows highlight positional differences. (B) Superimposition of the ELIC (PDB accession no. 2YN6), GLIC (pH 7.0; PDB accession no. 4NPQ), and ELIC-GLIC structures at the level of the ECD. The ECD pentamer comprising of residues 11–200 was superimposed at the Cα level. Black arrows show the direction of twist from ELIC to ELIC-GLIC (left) and from ELIC to GLIC (right). Key regions showing difference in position are marked by black circles.
Figure 4.
Figure 4.
Pore profile of the ELIC-GLIC chimera and GLIC structures. (A) Water-accessible region of the pore as determined by the MOLE PyMOL plugin (Petřek et al., 2007). Two subunits are shown, with residues lining the ion permeation pathway represented as sticks. (B) A close-up view of diagonal M2 helices. (C) Pore radius along the channel axis in the ELIC-GLIC chimera and in the GLIC-closed (PDB accession no. 4NPQ) and -open (PDB accession no. 4HFI) forms calculated using MOLE software (Petřek et al., 2007).
Figure 5.
Figure 5.
Loop C movements in the ELIC-GLIC chimera. (A) An overlay of ELIC-ECD in the apo (PDB accession no. 3RQU)- and GABA-flurazepam (PDB accession no. 4A96)–bound forms, with residues Asn184 and Ser189 highlighted (left). CW-EPR line shapes for the loop C positions in the apo conformation, and in the presence of 20 mM 3-AP, or at pH 3.0. The light and dark blue arrows highlight the immobile and mobile components of the spectra, respectively. (B) ELIC structure showing the location of Ser189 and corresponding cβ-cβ distances for the adjacent and nonadjacent subunits (left). Background-subtracted DEER echo intensity is plotted against evolution time and fit using model-free Tikhonov regularization. The corresponding interspin distance distribution (right). The arrows highlight the direction of change (orange, 3-AP; green, pH 3.0).
Figure 6.
Figure 6.
3-AP– and pH-induced conformational changes in loop F of the ELIC-GLIC chimera. (A) Locations of examined residues in ELIC-GLIC (left) and spin-normalized CW-EPR spectra of the residues in the apo state, with 20 mM 3-AP, and at pH 3.0 (right). (B) The corresponding distances mapped on the ELIC structure (PDB accession no. 3RQU; left). The DEER echo and the distance distribution under the three conditions (right). The peak values for distance distribution are marked for the apo state. The arrows highlight the direction of change (orange, 3-AP; green, pH 3.0).
Figure 7.
Figure 7.
Structural rearrangements at the domain interface in the ELIC-GLIC chimera. (A) Overlays of Apo-ELIC (PDB accession no. 3RQU) and ELIC-GABA-flurazepam (PDB accession no. 4A96) (left) and spin-normalized CW spectra of interface domain residues L29R1 (β1–β2 loop), V82R1 (β4–β5 loop), M114R1, and F116R1 (β6–β7 loop) in the apo state, in the presence of 20 mM 3-AP, or at pH 3.0 (right). (B) Overlay of GLIC structures in the closed (PDB accession no. 4NPQ) and open conformations (PDB accession no. 4HFI; left). CW-EPR spectra of K255R1 (M2–M3 linker) and F322R1 (M4) in the apo state, in the presence of 20 mM 3-AP, and at pH 3.0 (right).

References

    1. Adams P.D., Afonine P.V., Bunkóczi G., Chen V.B., Davis I.W., Echols N., Headd J.J., Hung L.W., Kapral G.J., Grosse-Kunstleve R.W., et al. . 2010. PHENIX: a comprehensive Python-based system for macromolecular structure solution. Acta Crystallogr. D Biol. Crystallogr. 66:213–221. 10.1107/S0907444909052925 - DOI - PMC - PubMed
    1. Altenbach C., Froncisz W., Hemker R., Mchaourab H., and Hubbell W.L.. 2005. Accessibility of nitroxide side chains: Absolute Heisenberg exchange rates from power saturation EPR. Biophys. J. 89:2103–2112. 10.1529/biophysj.105.059063 - DOI - PMC - PubMed
    1. Blanc E., Roversi P., Vonrhein C., Flensburg C., Lea S.M., and Bricogne G.. 2004. Refinement of severely incomplete structures with maximum likelihood in BUSTER-TNT. Acta Crystallogr. D Biol. Crystallogr. 60:2210–2221. 10.1107/S0907444904016427 - DOI - PubMed
    1. Bocquet N., Prado de Carvalho L., Cartaud J., Neyton J., Le Poupon C., Taly A., Grutter T., Changeux J.P., and Corringer P.J.. 2007. A prokaryotic proton-gated ion channel from the nicotinic acetylcholine receptor family. Nature. 445:116–119. 10.1038/nature05371 - DOI - PubMed
    1. Bocquet N., Nury H., Baaden M., Le Poupon C., Changeux J.P., Delarue M., and Corringer P.J.. 2009. X-ray structure of a pentameric ligand-gated ion channel in an apparently open conformation. Nature. 457:111–114. 10.1038/nature07462 - DOI - PubMed

Publication types