. 2015 Sep 28:16:214.
doi: 10.1186/s13059-015-0768-0.

Chromatin interaction analysis reveals changes in small chromosome and telomere clustering between epithelial and breast cancer cells

Affiliations

Chromatin interaction analysis reveals changes in small chromosome and telomere clustering between epithelial and breast cancer cells

A Rasim Barutcu et al. Genome Biol. .

Abstract

Background: Higher-order chromatin structure is often perturbed in cancer and other pathological states. Although several genetic and epigenetic differences have been charted between normal and breast cancer tissues, changes in higher-order chromatin organization during tumorigenesis have not been fully explored. To probe the differences in higher-order chromatin structure between mammary epithelial and breast cancer cells, we performed Hi-C analysis on MCF-10A mammary epithelial and MCF-7 breast cancer cell lines.

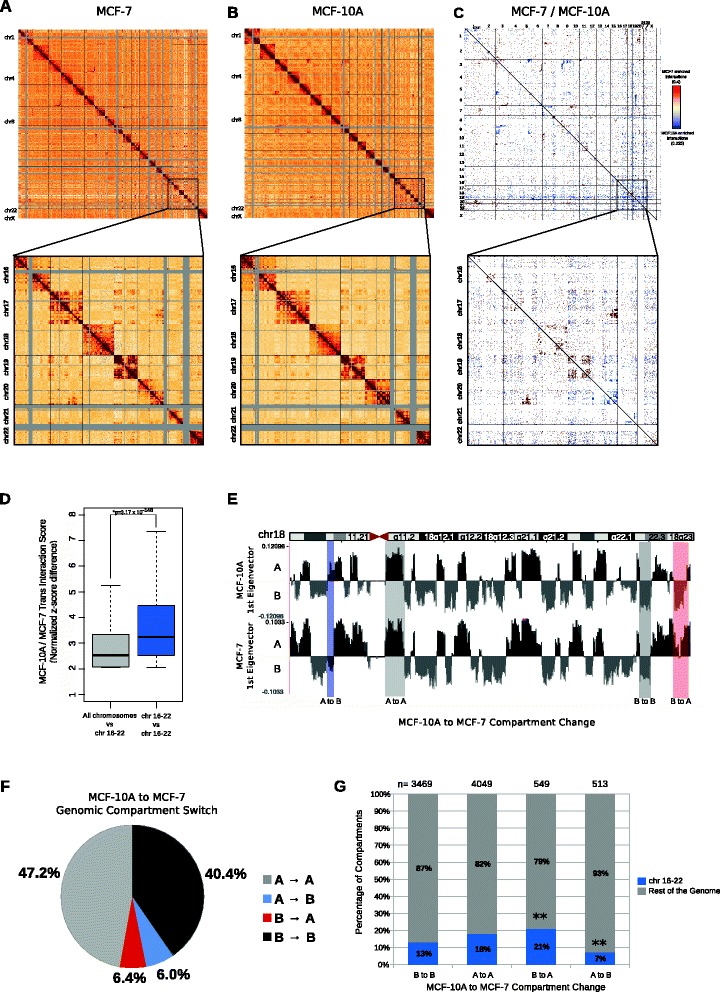
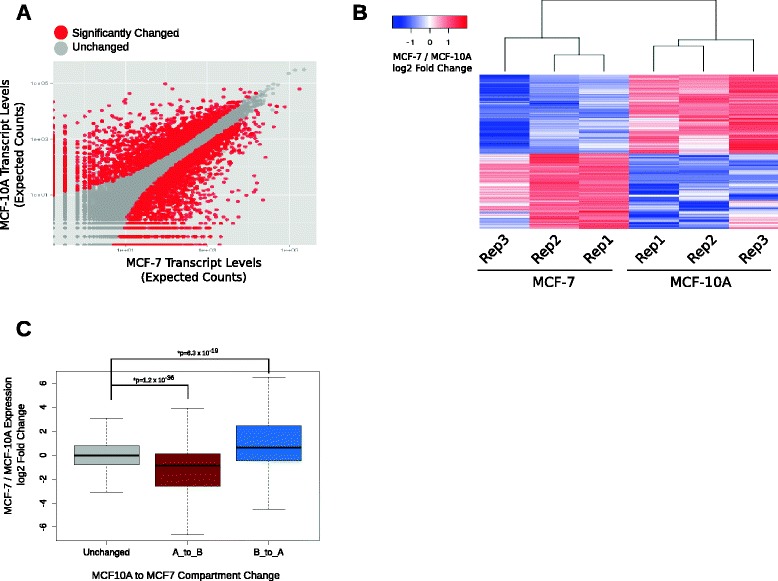
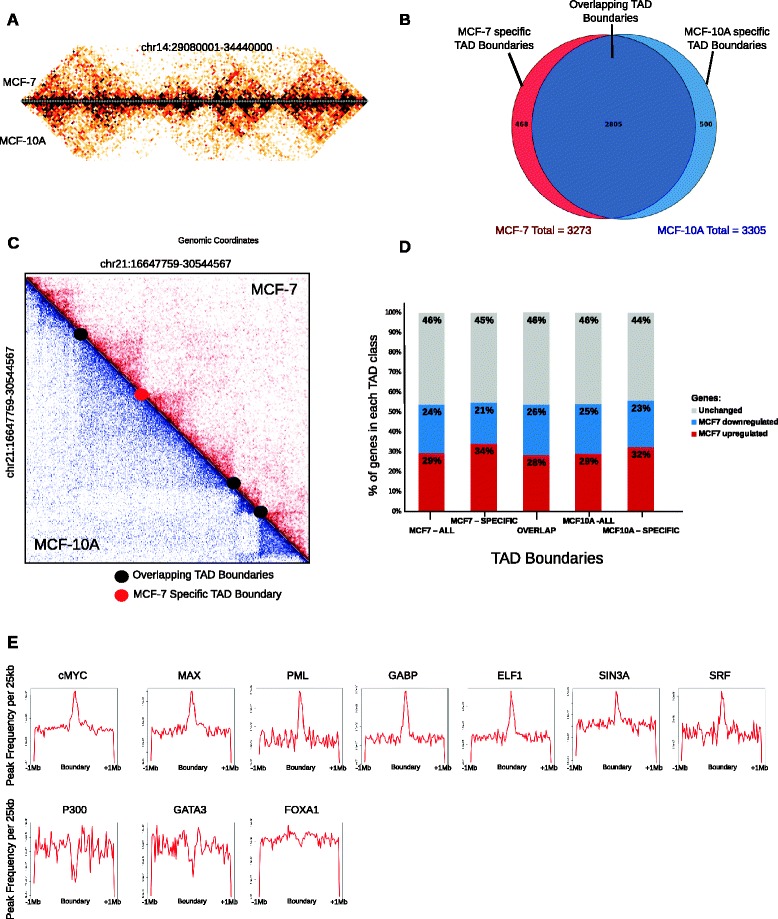
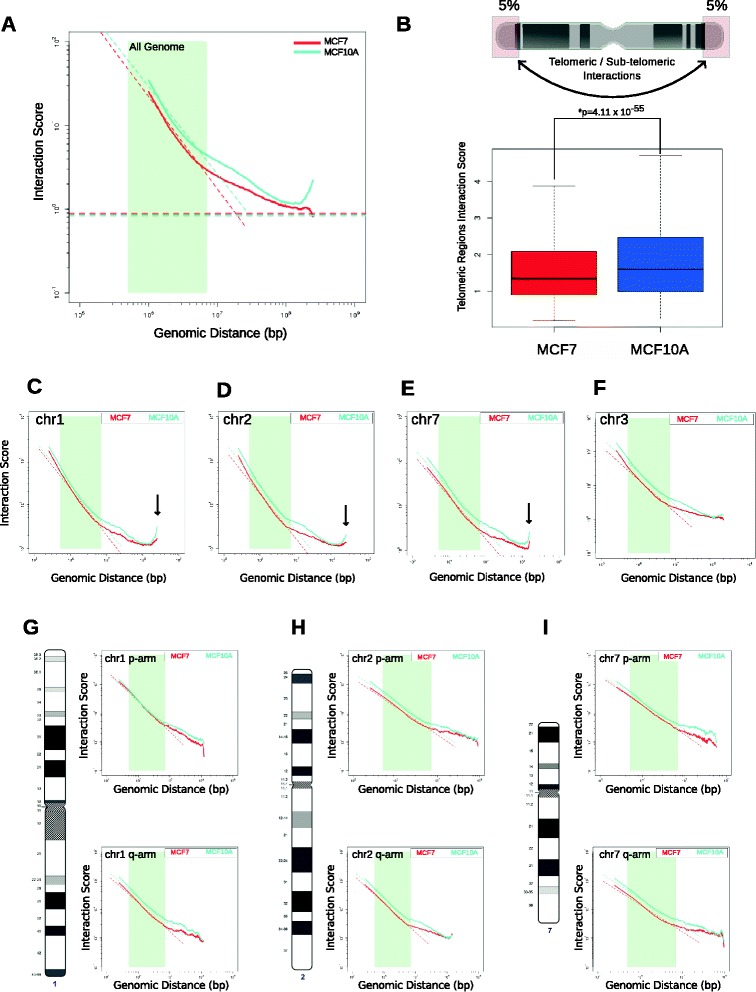
Results: Our studies reveal that the small, gene-rich chromosomes chr16 through chr22 in the MCF-7 breast cancer genome display decreased interaction frequency with each other compared to the inter-chromosomal interaction frequency in the MCF-10A epithelial cells. Interestingly, this finding is associated with a higher occurrence of open compartments on chr16-22 in MCF-7 cells. Pathway analysis of the MCF-7 up-regulated genes located in altered compartment regions on chr16-22 reveals pathways related to repression of WNT signaling. There are also differences in intra-chromosomal interactions between the cell lines; telomeric and sub-telomeric regions in the MCF-10A cells display more frequent interactions than are observed in the MCF-7 cells.

Conclusions: We show evidence of an intricate relationship between chromosomal organization and gene expression between epithelial and breast cancer cells. Importantly, this work provides a genome-wide view of higher-order chromatin dynamics and a resource for studying higher-order chromatin interactions in two cell lines commonly used to study the progression of breast cancer.


Figures

Fig. 1
Fig. 1
Hi-C analyses identify that small chromosomes (chr16–22) in the MCF10A genome show preferential associations with each other. Genome-wide all-by-all 1-Mb Hi-C interaction heatmap of MCF-10A (a) and MCF-7 (b) cells. The chromosomes in all-by-all heatmaps are stacked from top left to bottom right in order (chr1, chr2…chr22 and chrX). The gray regions indicate repetitive regions (such as centromeres) in which the sequencing reads could not be mapped. Intra-chromosomal interactions were much more frequent than inter-chromosomal interactions. The blocks of enriched inter-chromosomal interactions represent the translocated regions. In the lower panels, enlargements of the cis- and trans-interactions for chr16 through chr22 are shown. c Genome-wide heatmap of significant differential interactions between MCF-10A and MCF-7. Each dot denotes a genomic region of 6.5 Mb. Chromosomes are stacked from top left to bottom right from chr1 through chr22 and chrX. The red color indicates MCF-7-enriched interactions and the blue color indicates MCF-10A-enriched interactions. The white regions denote interacting regions that are not significantly changed between the cell lines. In the lower panel, significant interactions within and between chr16–22 are shown. d Boxplot showing the MCF-10A/MCF-7 inter-chromosomal interaction frequency differences between chr16 through chr22 and all the other chromosomes (grey) or between chr16 through chr22 (blue). The p value was determined using Wilcoxon rank-sum test. e First principal component of chr18, representing the open A-type (black) and closed B-type (grey) compartmentalization. Highlighted bars represent examples of regions with either stable or differential compartmentalization. The differential compartments are defined as genomic regions in which one type of compartmentalization is observed in one cell line and the other compartment type in the second cell line. f Pie chart showing the genomic compartment changes between MCF-10A and MCF-7 genomes. “A” and “B” denote the open and closed compartments, respectively. “A → A” represents compartments that are open in both cell lines, “B → B” represents compartments that are closed in both cell lines, “A → B” denotes compartments that are open in MCF-10A but closed in MCF-7, and “B → A” denotes compartments that are closed in MCF-10A and open in MCF-7. g Bar graph showing the percentage of compartments that have switched (A → B or B → A) or remained similar (A → A or B → B) between MCF-10A and MCF-7 genomes for chr16 through chr22 (blue) and the rest of the genome (grey). Chr16–22 display a higher percentage of B → A compartment switching, and a lower percentage of A → B compartment switching between MCF-10A and MCF-7, suggesting a more open compartmentalization in MCF-7. **P value < 0.001: Chi-square with Yates’ correction
Fig. 2
Fig. 2
Differentially expressed genes are enriched at cell-specific genomic compartments. a Scatter plot showing differential gene expression between MCF-10A and MCF-7 cells. The axes represent normalized RNA-seq log2 gene expression counts. Red dots denote genes whose expression changed significantly and grey dots denote genes whose expression was unchanged. b Heatmap showing the MCF-7 up- and down-regulated genes for each biological replicate. Differential expression analyses identified 2437 MCF-7 up-regulated and 2427 MCF-7 down-regulated genes (log2 fold change > 1, p < 0.01) with high reproducibility. c MCF-7/MCF-10A log2 fold change expression boxplot of all the genes residing at regions for different compartmental switch categories. The compartments that are A → B and B → A show significantly decreased and increased expression levels, respectively. The p valuewas determined with Wilcoxon rank-sum test
Fig. 3
Fig. 3
Topologically associating domains are similar between MCF-10A and MCF-7. a TADs are similar between MCF-10A and MCF-7 genomes. An example heatmap of a portion of MCF-10A chr14 at 40 kb resolution, where the upper part of the heatmap shows the MCF-7 TADs and the bottom part shows the MCF-10A TADs. b Venn diagram showing that the majority (~85 %) of all the TAD boundaries between MCF7 and MCF10A are conserved. c Heatmap showing an example of a differential TAD between MCF-10A (blue) and MCF-7 (red) on chr21 (chr21:16647759–30544567). The black dots represent the overlapping boundaries that are present in both cell lines, and the red dot denotes the MCF7-specific TAD boundary. d The percentage of unchanged (grey), MCF7 down-regulated (blue) and MCF7 up-regulated (red) genes located at each TAD boundary category. e Frequency plots of factors enriched at MCF- 7 TAD boundaries per 25 kb for ±1 Mb of every MCF-7 TAD boundary
Fig. 4
Fig. 4
Telomeric and sub-telomeric regions in the MCF-10A genome display increased interaction frequencies. a Scaling plot of interaction frequencies against genomic distance for the MCF7 and MCF10A genomes. The MCF10A genome showed increased interaction frequency at genomic distances >200 Mb, suggesting telomere/sub-telomere associations. b Quantification of the interaction frequency between the telomeric regions (5 % of the ends by length) of each chromosome in MCF7 and MCF10A. The p value was determined by Wilcoxon rank-sum test. Scaling plots of MCF-10A and MCF-7 for chr1 (c), chr2 (d), chr7 (e), and chr3 (f). Chromosomes 1, 2 and 7 displayed an increased interaction frequency at large distances in MCF-10A but chromosome 3 did not. Scaling plots of individual chromosome arms for chr1 (g), chr2 (h), and chr7 (i)

References

    1. Bickmore WA. The spatial organization of the human genome. Annu Rev Genomics Hum Genet. 2013;14:67–84. doi: 10.1146/annurev-genom-091212-153515. - DOI - PubMed
    1. Bonora G, Plath K, Denholtz M. A mechanistic link between gene regulation and genome architecture in mammalian development. Curr Opin Genet Dev. 2014;27:92–101. doi: 10.1016/j.gde.2014.05.002. - DOI - PMC - PubMed
    1. de Laat W, Duboule D. Topology of mammalian developmental enhancers and their regulatory landscapes. Nature. 2013;502:499–506. doi: 10.1038/nature12753. - DOI - PubMed
    1. Cancer Genome Atlas N Comprehensive molecular portraits of human breast tumours. Nature. 2012;490:61–70. doi: 10.1038/nature11412. - DOI - PMC - PubMed
    1. Stephens PJ, Tarpey PS, Davies H, Van Loo P, Greenman C, Wedge DC, et al. The landscape of cancer genes and mutational processes in breast cancer. Nature. 2012;486:400–404. - PMC - PubMed

Publication types

Associated data