. 2015 Dec;14(6):1103-12.
doi: 10.1111/acel.12402. Epub 2015 Sep 29.

Homeostatic dysregulation proceeds in parallel in multiple physiological systems

Affiliations

Homeostatic dysregulation proceeds in parallel in multiple physiological systems

Qing Li et al. Aging Cell. 2015 Dec.

Abstract

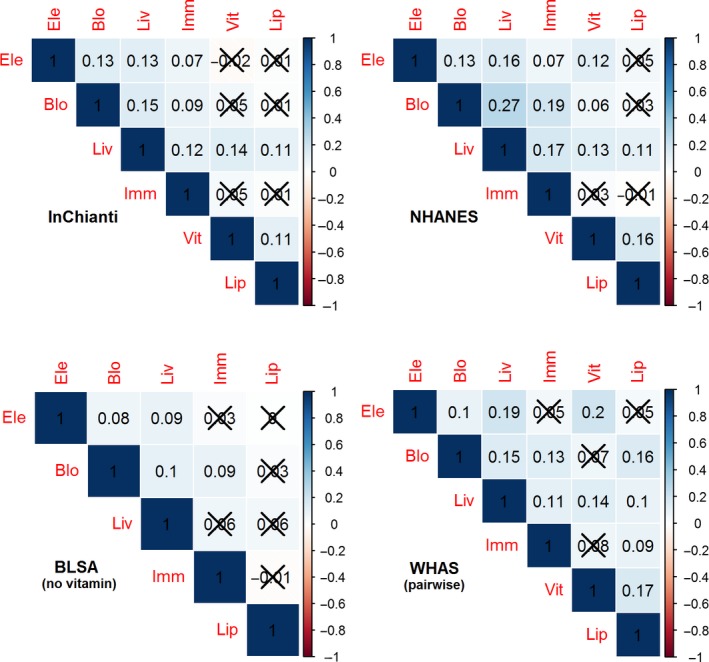
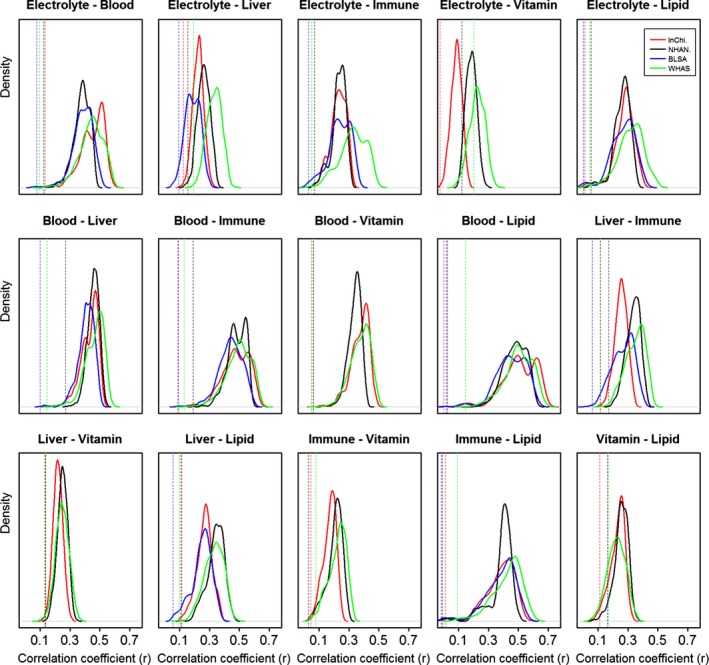
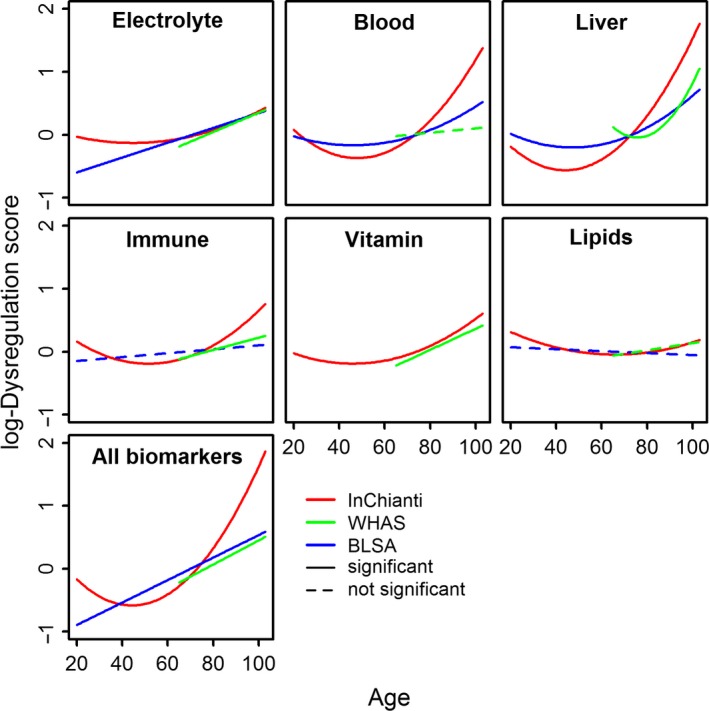
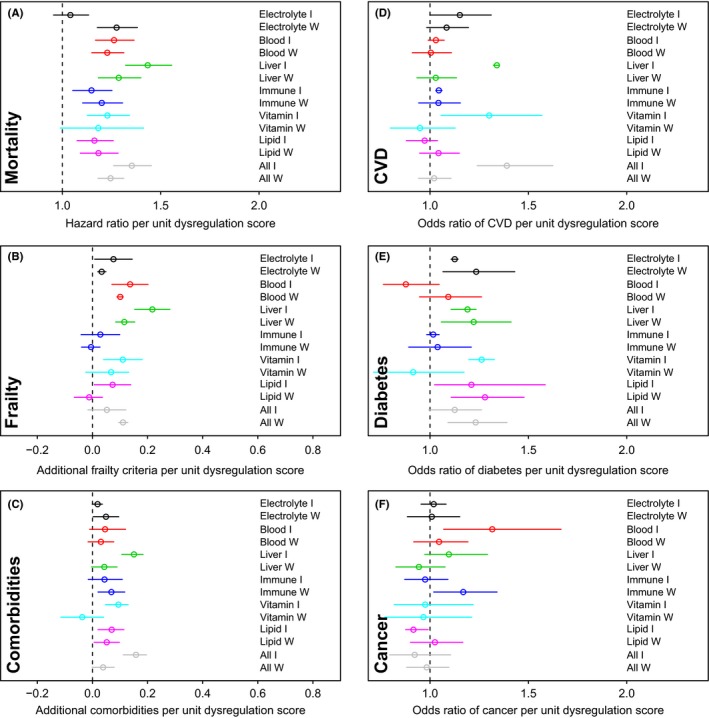
An increasing number of aging researchers believes that multi-system physiological dysregulation may be a key biological mechanism of aging, but evidence of this has been sparse. Here, we used biomarker data on nearly 33, 000 individuals from four large datasets to test for the presence of multi-system dysregulation. We grouped 37 biomarkers into six a priori groupings representing physiological systems (lipids, immune, oxygen transport, liver function, vitamins, and electrolytes), then calculated dysregulation scores for each system in each individual using statistical distance. Correlations among dysregulation levels across systems were generally weak but significant. Comparison of these results to dysregulation in arbitrary 'systems' generated by random grouping of biomarkers showed that a priori knowledge effectively distinguished the true systems in which dysregulation proceeds most independently. In other words, correlations among dysregulation levels were higher using arbitrary systems, indicating that only a priori systems identified distinct dysregulation processes. Additionally, dysregulation of most systems increased with age and significantly predicted multiple health outcomes including mortality, frailty, diabetes, heart disease, and number of chronic diseases. The six systems differed in how well their dysregulation scores predicted health outcomes and age. These findings present the first unequivocal demonstration of integrated multi-system physiological dysregulation during aging, demonstrating that physiological dysregulation proceeds neither as a single global process nor as a completely independent process in different systems, but rather as a set of system-specific processes likely linked through weak feedback effects. These processes--probably many more than the six measured here--are implicated in aging.

Keywords: aging; biomarker; homeostasis; multi-system dysregulation; physiology; statistical distance.


Figures

Figure 1
Figure 1
Correlations among age‐adjusted system‐specific dysregulation scores. The dysregulation scores were calculated from the six a priori biomarker groupings and then adjusted for age. Darker background color indicates stronger correlation, and values not significant at α = 0.05 are Xed out. The correlations are positive and weak in general, showing semi‐independence (or very weak dependence) of the six system‐specific dysregulation scores.
Figure 2
Figure 2
Quasi‐optimal separation of systems with a priori groups. The solid curves show the kernel densities by dataset of the correlation coefficients between two age‐adjusted dysregulation scores as calculated from all possible arbitrary biomarker groupings with the same sizes as the two a priori groups. Positions of the vertical dotted lines indicate correlations among the two age‐adjusted dysregulation scores corresponding to the a priori biomarker groupings, i.e., the results presented in Fig. 1. Each panel shows a possible pair of two systems. Different colors are used for different datasets. The figure shows that a priori biomarker groupings lead to much more weakly correlated dysregulation scores than arbitrary groupings and are close to as perfectly separated as possible, although a few correlations in the distribution are as low as the a priori correlations.
Figure 3
Figure 3
Changes in dysregulation scores with age, by physiological system. The first six panels show the association between age and dysregulation scores of the corresponding systems. The last panel shows the association between age and global dysregulation. We first fitted the quadratic model. If the quadratic term was significant (α = 0.05), we showed it with a solid quadratic curve. When the quadratic term was not significant, we fitted the linear model. Significant results are shown with a solid line and non‐significant results with a dashed line. Age started from 65 for Women's Health and Aging Study (WHAS) and the other two datasets had a small fraction of younger patients. The figure indicates a clear increase of system‐specific and global dysregulation scores with age. Note that the analyses here are longitudinal, so National Health and Nutrition Examination Survey (NHANES) data were not used.
Figure 4
Figure 4
Relationships between dysregulation scores and health outcomes. Estimations (points) together with 95% CIs (segments) for relationships between health outcomes and dysregulation scores by physiological system, as well as global dysregulation scores. Results are based on regression models adjusting for age and sex. Different colors indicate different systems. ‘W’ indicates Women's Health and Aging Study (WHAS) and ‘I’ InCHIANTI. Associations between dysregulation scores and certain health outcomes are stronger, while the association is more ambiguous for CVD and not significant for cancer.

References

    1. Arbeev KG, Ukraintseva SV, Akushevich I, Kulminski AM, Arbeeva LS, Akushevich L, Culminskaya IV, Yashin AI (2011) Age trajectories of physiological indices in relation to healthy life course. Mech. Ageing Dev. 132, 93–102. - PMC - PubMed
    1. Bender R, Lange S (2001) Adjusting for multiple testing—when and how? J. Clin. Epidemiol. 54, 343–349. - PubMed
    1. Cohen AA, Martin LB, Wingfield JC, McWilliams SR, Dunne JA (2012) Physiological regulatory networks: ecological roles and evolutionary constraints. Trends Ecol. Evol. 27, 428–435. - PubMed
    1. Cohen AA, Milot E, Yong J, Seplaki CL, Fülöp T, Bandeen‐Roche K, Fried LP (2013) A novel statistical approach shows evidence for multi‐system physiological dysregulation during aging. Mech. Ageing Dev. 134, 110–117. - PMC - PubMed
    1. Cohen AA, Milot E, Li Q, Legault V, Fried LP, Ferrucci L (2014) Cross‐population validation of statistical distance as a measure of physiological dysregulation during aging. Exp. Gerontol. 57, 203–210. - PMC - PubMed

Publication types