. 2015 Sep 29:6:8461.
doi: 10.1038/ncomms9461.

Exciton dynamics of C60-based single-photon emitters explored by Hanbury Brown-Twiss scanning tunnelling microscopy

Affiliations

Exciton dynamics of C60-based single-photon emitters explored by Hanbury Brown-Twiss scanning tunnelling microscopy

P Merino et al. Nat Commun. .

Abstract

Exciton creation and annihilation by charges are crucial processes for technologies relying on charge-exciton-photon conversion. Improvement of organic light sources or dye-sensitized solar cells requires methods to address exciton dynamics at the molecular scale. Near-field techniques have been instrumental for this purpose; however, characterizing exciton recombination with molecular resolution remained a challenge. Here, we study exciton dynamics by using scanning tunnelling microscopy to inject current with sub-molecular precision and Hanbury Brown-Twiss interferometry to measure photon correlations in the far-field electroluminescence. Controlled injection allows us to generate excitons in solid C60 and let them interact with charges during their lifetime. We demonstrate electrically driven single-photon emission from localized structural defects and determine exciton lifetimes in the picosecond range. Monitoring lifetime shortening and luminescence saturation for increasing carrier injection rates provides access to charge-exciton annihilation dynamics. Our approach introduces a unique way to study single quasi-particle dynamics on the ultimate molecular scale.


Figures

Figure 1
Figure 1. Scheme of the experimental setup of a scanning tunnelling microscope (STM) extended by a Hanbury Brown–Twiss (HBT) interferometer and energy diagram of the luminescence process.
(a) The STM tip extracts electrons from a C60 molecule at the surface of the film. Extraction conditions are controlled by the tip position (x,y) as well as the applied voltage Ubias and the extracted tunnel current Itunnel. As the hole is trapped at the emission centre (EC), it can capture an electron from the substrate and form an exciton. The recombination event can be detected by one of the two time-resolving photon counters (APD: avalanche photo diode). One APD operates as a timer-start and the other one as a timer-stop for a time-correlated single-photon counting card. The distribution of measured start-stop times Δt provides the second-order photon correlation function g(2)(Δt). For sub-Poissonian light sources, for example, a single-photon emitter, events at smaller |Δt| values occur less often than events at larger |Δt| ; g(2)(Δt) shows a minimum at Δt=0. (b) Energy level scheme and electron flow within the C60 multilayer containing an EC. The detailed mechanism is described in the text. CB, conduction band; VB, valence band.
Figure 2
Figure 2. Three-dimensional topographic STM image of the C60 surface overlaid with the simultaneously obtained electroluminescence photon map.
The colour represents the detected light intensity. Several emission centres (ECs) of different size and intensity can be identified. Arrows indicate the positions of an EC, a C60 molecule within the surface layer, and a 0.8nm high C60 crystal step (image size: 25 × 25 nm2, Ubias=−3.0 V, Itunnel=30 pA).
Figure 3
Figure 3. Nanoscale characterization of a single-photon emission centre.
(a) Topographic STM image, Ubias=−3.2 V, Itunnel=51 pA; scale bar, 2 nm. (b) Simultaneously recorded electroluminescence photon map, the false colour scale bar represents the light intensity 0–67 kcounts s−1. (c) Electroluminescence optical spectrum recorded on the molecule marked by the green cross in a (120 s, Ubias=−3.2 V, Itunnel=500 pA). (d) Photon correlation (green open circles) measured with the HBT interferometer during electron extraction on the molecule marked by the green cross in a; integration time 3 h, time correlated single-photon detection channel width 50 ps, Ubias=−3.2 V, Itunnel=51 pA. The dashed black line is a best fit based on the characteristics of a single-photon source convoluted with the detector time resolution. The dotted red line represents the same fit after removing the detector broadening.
Figure 4
Figure 4. Exciton-charge annihilation and three-state model.
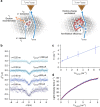
(a) Graphical representation of the three-states discussed in detail in the text. (b) Blue circles: second-order correlation function g2 (Δt) measured for the currents indicated on the right-hand side (Ubias=−3.2 V). The three upper curves have been upshifted for clarity by multiples of one. The black lines are best fits for a single-photon emission convoluted by the detector time resolution function (full-width at half-maximum=1.2 ns). The values on the left-hand side are the time constants from the corresponding fits. (c) Inverse measured time constants plotted as a function of current (in units of elementary charge per nanosecond). The interception with the vertical axis yields the true exciton lifetime without charge–exciton interaction. The positive slope quantifies the efficiency of charge exciton annihilation, see equation (1). The error bars represent the precision (systematic error) of the lifetime after correction for the measured detector resolution. (d) Blue circles: Photon intensity in one avalanche photo detector versus tunnel current (Ubias=−3.0 V). Red line: best fit to the three-state model including exciton charge annihilation according to equation (2).

References

    1. Agranovich V. Excitations in Organic Solids Vol. 142 (, OUP Oxford (2009).
    1. Ye Z. et al.. Probing excitonic dark states in single-layer tungsten disulphide. Nature 513, 214–218 (2014). - PubMed
    1. Ugeda M. M. et al.. Giant bandgap renormalization and excitonic effects in a monolayer transition metal dichalcogenide semiconductor. Nat. Mater. 13, 1091–1095 (2014). - PubMed
    1. Reineke S. et al.. White organic light-emitting diodes with fluorescent tube efficiency. Nature 459, 234–238 (2009). - PubMed
    1. Yella A. et al.. Porphyrin-sensitized solar cells with cobalt (II/III)–based redox electrolyte exceed 12 percent efficiency. Science 334, 629–634 (2011). - PubMed