. 2015 Oct 1;526(7571):131-5.
doi: 10.1038/nature15260. Epub 2015 Sep 23.

Single-cell analysis reveals a stem-cell program in human metastatic breast cancer cells

Affiliations

Single-cell analysis reveals a stem-cell program in human metastatic breast cancer cells

Devon A Lawson et al. Nature. .

Abstract

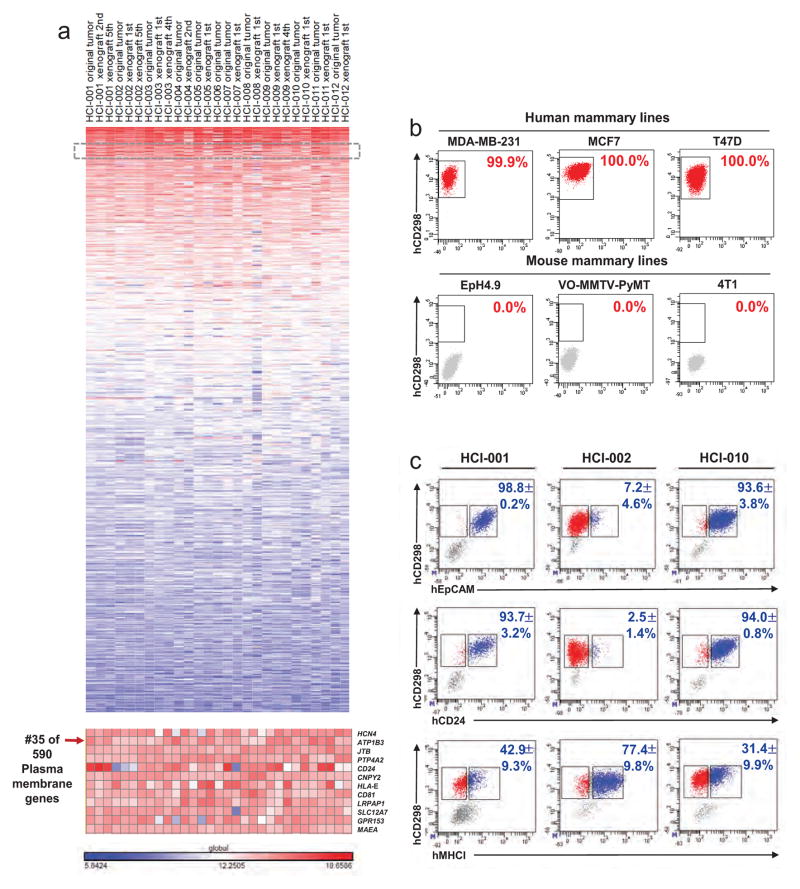
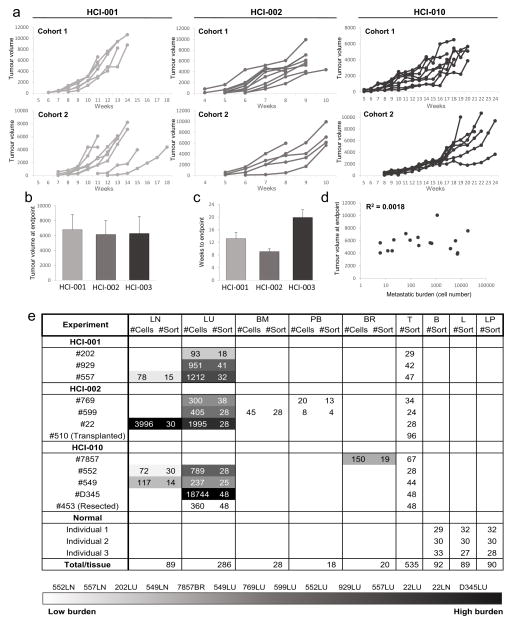
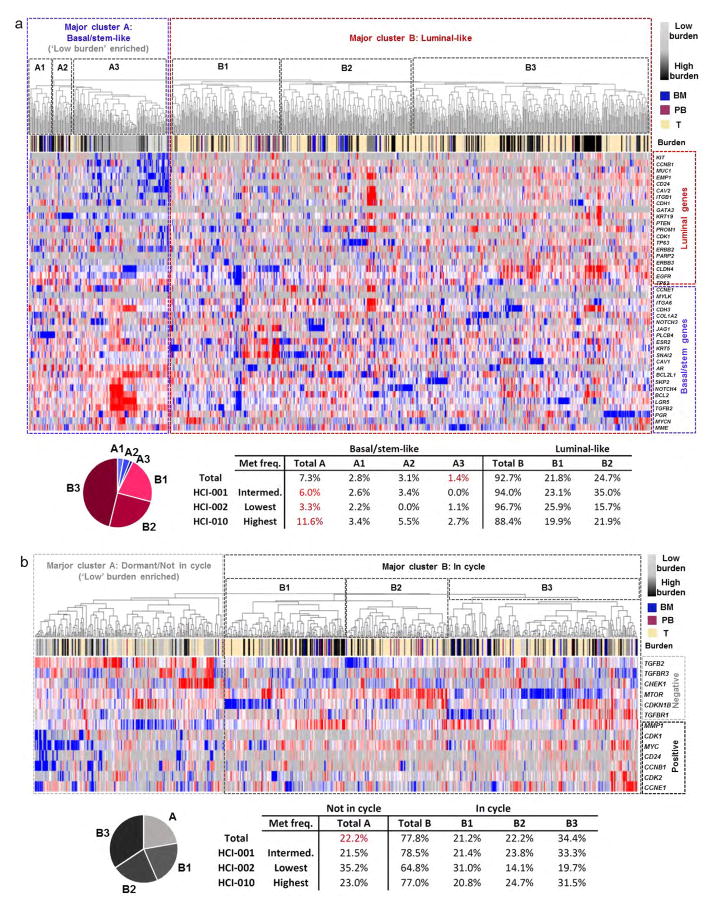
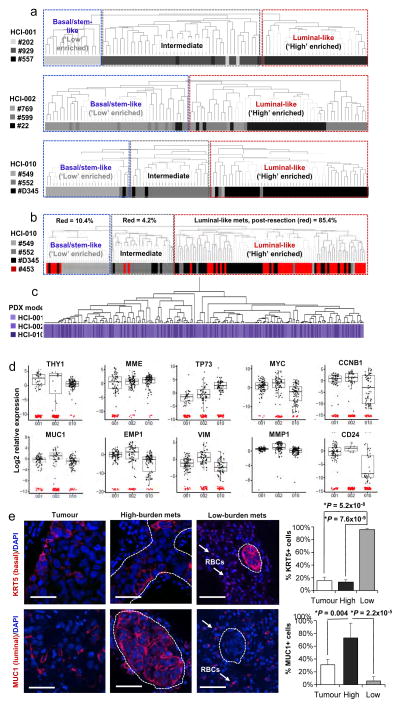
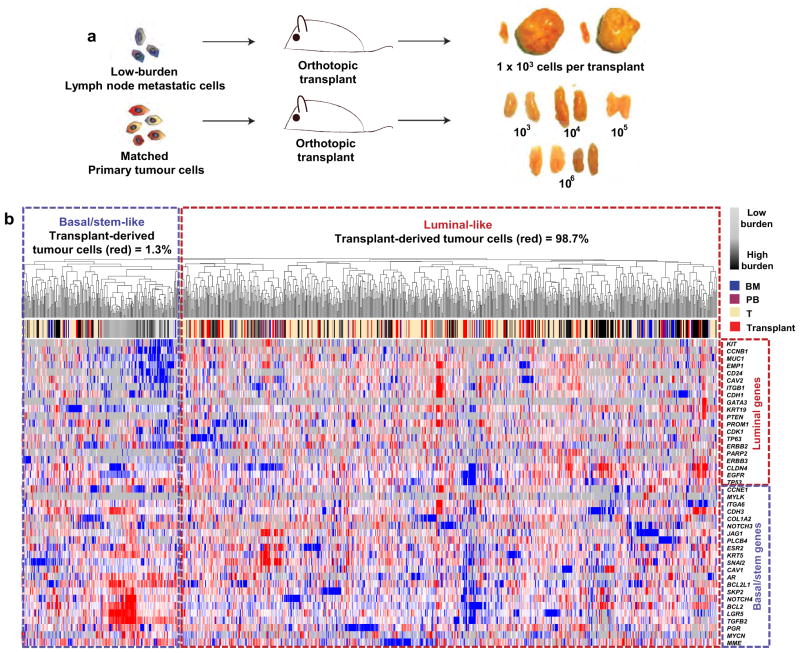
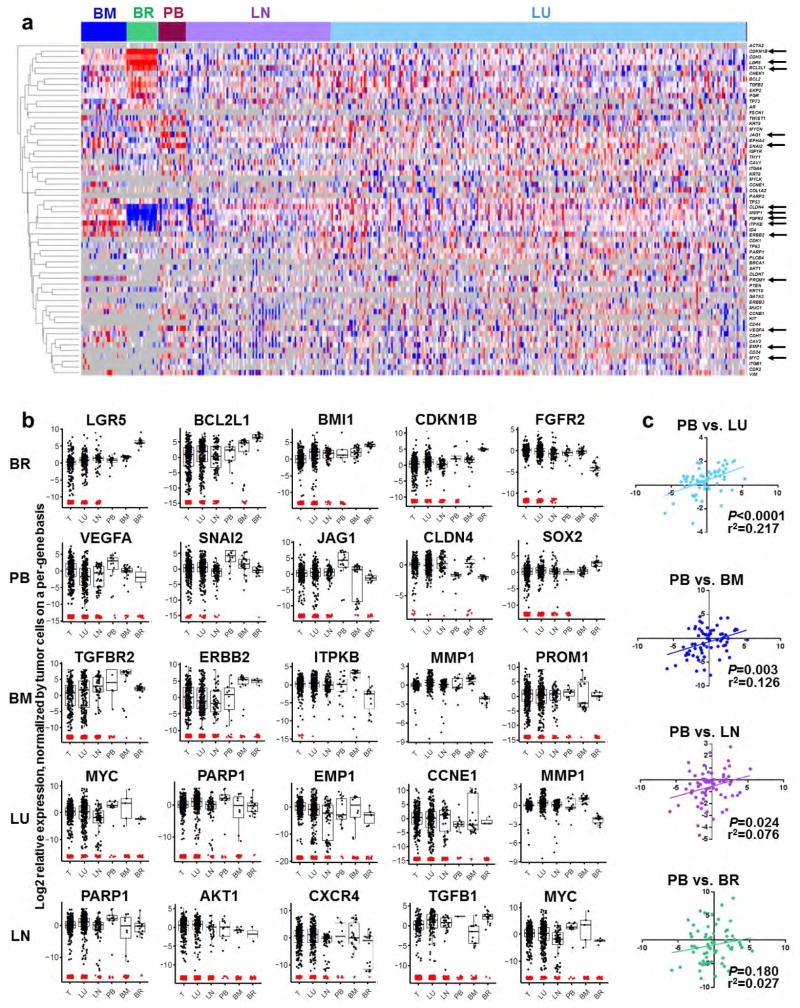
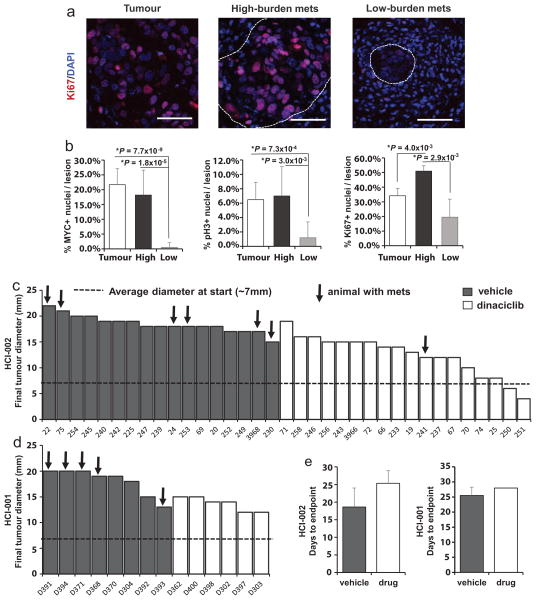
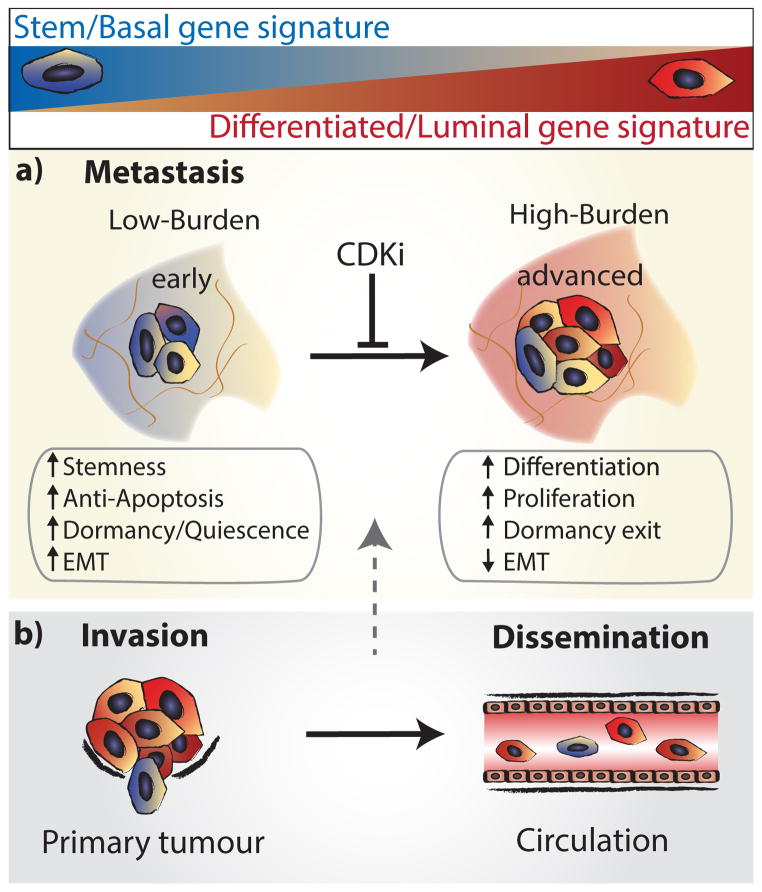
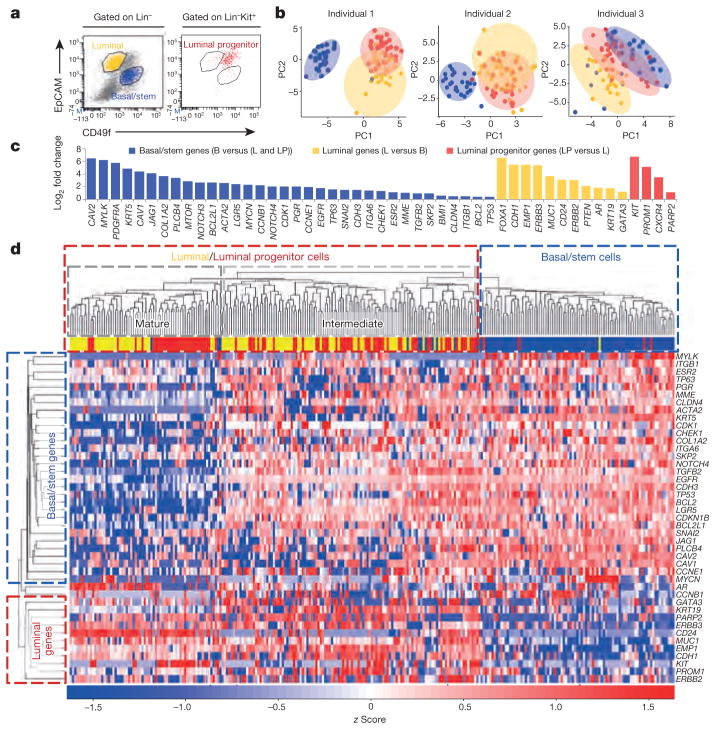
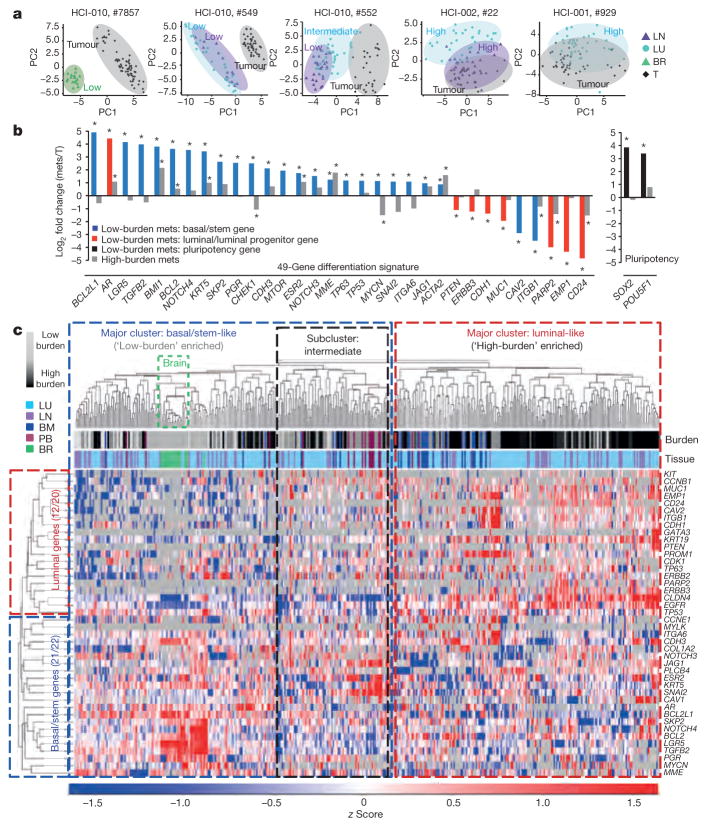
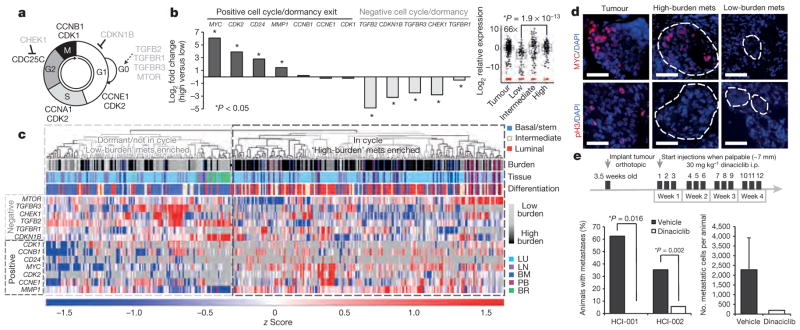
Despite major advances in understanding the molecular and genetic basis of cancer, metastasis remains the cause of >90% of cancer-related mortality. Understanding metastasis initiation and progression is critical to developing new therapeutic strategies to treat and prevent metastatic disease. Prevailing theories hypothesize that metastases are seeded by rare tumour cells with unique properties, which may function like stem cells in their ability to initiate and propagate metastatic tumours. However, the identity of metastasis-initiating cells in human breast cancer remains elusive, and whether metastases are hierarchically organized is unknown. Here we show at the single-cell level that early stage metastatic cells possess a distinct stem-like gene expression signature. To identify and isolate metastatic cells from patient-derived xenograft models of human breast cancer, we developed a highly sensitive fluorescence-activated cell sorting (FACS)-based assay, which allowed us to enumerate metastatic cells in mouse peripheral tissues. We compared gene signatures in metastatic cells from tissues with low versus high metastatic burden. Metastatic cells from low-burden tissues were distinct owing to their increased expression of stem cell, epithelial-to-mesenchymal transition, pro-survival, and dormancy-associated genes. By contrast, metastatic cells from high-burden tissues were similar to primary tumour cells, which were more heterogeneous and expressed higher levels of luminal differentiation genes. Transplantation of stem-like metastatic cells from low-burden tissues showed that they have considerable tumour-initiating capacity, and can differentiate to produce luminal-like cancer cells. Progression to high metastatic burden was associated with increased proliferation and MYC expression, which could be attenuated by treatment with cyclin-dependent kinase (CDK) inhibitors. These findings support a hierarchical model for metastasis, in which metastases are initiated by stem-like cells that proliferate and differentiate to produce advanced metastatic disease.


Conflict of interest statement

The authors declare no competing financial interests.

Figures

Extended Data Figure 1
Extended Data Figure 1. Identification and validation of CD298 for detection of human cells
a, Analysis of published microarray data identified CD298 as highly expressed on many PDX breast cancer models and corresponding original patient tumours. The heatmap shows genes rank ordered from highest to lowest for raw expression values across all samples. The inset (bottom) highlights expression for CD298 (also known as ATP1B3). CD298 ranked number 35 out of over 590 plasma membrane genes. b, FACS for CD298 on human (top) and mouse (bottom) mammary cell lines to establish species specificity. c, FACS on primary PDX tumour cells comparing CD298 expression with other markers used in related applications (EpCAM, CD24, MHC I; percentages indicate dual-positive cells) (n =3). EpCAM is used to identify CTCs in the clinic; CD24 is a pan-epithelial marker; and MHC I is used as a ubiquitous marker on all nucleated cells. These markers were not used in this study because they were not robustly expressed on all PDX models.
Extended Data Figure 2
Extended Data Figure 2. Analysis of primary tumour growth kinetics and metastasis in PDX mice
a, Weekly caliper measurements of primary tumours in two independent cohorts of animals show that growth kinetics were consistent within each PDX model. b, Bar graph shows that the average tumour volume at the endpoint was similar across PDX models. c, Bar graph shows the average number of weeks for tumours to reach endpoint (20–25 mm diameter) in each PDX model. d, Correlation plot shows that metastatic burden did not correlate with tumour volume in PDX animals. e, Table summarizing the number of metastatic cells detected (#Cells) and analysed (#Sort) from each tissue from each PDX animal. Tissues were rank ordered according to metastatic burden, from lowest (lightest grey) to highest (black). The table also shows the number of primary tumour cells analysed (#Sort) from PDX animals, and the number of normal mammary epithelial cells analysed (#Sort) from mammoplasty patients (Individuals 1, 2, and 3). ‘Transplanted’ indicates primary tumour cells derived from transplant of lymph node metastatic cells into marry fat pads; ‘resected’ indicates lung metastatic cells analysed 8 weeks after resection of the primary tumour. B, basal/stem; BM, bone marrow; BR, brain; L, luminal; LN, lymph node; LP, luminal progenitor; LU, lung; PB, peripheral blood; T, primary tumour.
Extended Data Figure 3
Extended Data Figure 3. Primary tumours contain rare stem-like cells
a, Unsupervised hierarchical clustering of metastatic and primary tumour cells from 10 animals (Extended Data Fig. 2e lists cells analysed from each animal) based on their expression of the 49-gene differentiation signature. The dendrogram shows two major clusters, where major cluster A contains basal/ stem-like cells and major cluster B contains more luminal-like cells. The majority of low-burden metastatic cells reside in subcluster A3. 1.4% of the primary tumour cells analysed in this study reside in subcluster A3, and are therefore similar to low-burden metastatic cells in their stem-like differentiation status. The pie graph and table list the percentage of primary tumour cells that reside in each cluster. The table also shows the data by PDX model. b, Unsupervised hierarchical clustering of metastatic and primary tumour cells, based on their expression of genes associated with cell cycle and dormancy. Two major clusters are evident. Major cluster A contains cells with a less-proliferative signature, which express higher levels of ‘negative’ cell-cycle-associated genes and lower levels of ‘positive’ cell-cycle-associated genes. Major cluster B contains cells with a more proliferative signature. The majority of low-burden metastatic cells reside in major cluster A, and possess a less-proliferative signature. The pie chart and table show the number of primary tumour cells in each cluster.
Extended Data Figure 4
Extended Data Figure 4. The correlation between differentiation and metastatic burden is conserved in each PDX model
a, Unsupervised hierarchical clustering of lung metastatic cells from each PDX model is shown separately. Lung metastatic cells were specifically chosen for this analysis because they were the only tissue for which there were sufficient numbers of low- and high-burden cells. In each dendrogram, low-burden metastatic cells form a distinct cluster due to their basal/stem-like expression signature. High-burden metastatic cells also form distinct clusters and express higher levels of luminal genes. Supplementary Data 2 shows the entire heatmap for each PDX model. b, Unsupervised hierarchical clustering of lung metastatic cells that developed after primary tumour resection (#453, red) at 10–12 mm in diameter. Post-resection metastatic cells were clustered with lung metastatic cells from non-resected animals to investigate their differentiation status. All animals bore the HCI-010 model. 85.4% of post-resection metastatic cells displayed a luminal-like expression pattern, showing that luminal-like metastatic cells can arise from cells that disseminate at early stages of primary tumour growth. Supplementary Data 2 shows the entire heatmap. c, Unsupervised hierarchical clustering of lung metastatic cells from all three PDX models by their expression of the top genes differentially expressed between them. Although there were statistically significant differences between the models, the dendrogram shows that they were not powerful enough to cluster the cells separately by model. Supplementary Data 2 shows the entire heatmap. d, Box plots show top selected genes differentially expressed between the three PDX models. By ANOVA, 53 genes were significantly differentially expressed (P <0.05, Supplementary Data 3). e, Immunofluorescence stains for basal and luminal lineage-specific proteins (red) in micro- and macrometastatic lesions. Autofluorescent red blood cells (RBCs) are also present in the lung (arrows), but do not represent positive immunostaining. Scale bars, 50 μm. Bar graphs quantify the percentage of low- and high-burden metastatic cells, and primary tumour cells that were positive for antibody staining. Data from at least three fields, in three different mice was collected from each group, and P values were calculated as described in the Methods. Error bars represent standard deviation.
Extended Data Figure 5
Extended Data Figure 5. Low-burden metastatic cells have tumour-initiating and differentiation capacity
a, Schematic overview of orthotopic transplant experiments to investigate the tumour-initiating and differentiation capacity of low-burden metastatic cells. Images of resulting grafts show that 2/4 transplants of low-burden cells grew large tumours, while 0/10 transplants from primary tumour cells developed tumours. b, Unsupervised hierarchical clustering of tumour cells derived from transplants of low-burden metastatic cells. Transplant-derived tumour cells were clustered with metastatic and primary tumour cells from previous experiments (Extended Data Fig. 3a) to investigate their differentiation status. Transplant-derived tumour cells were heterogeneous, where 1.3% of them were basal/stem-like, and 98.7% of them clustered with more luminal-like cells. This shows that low-burden basal/ stem-like metastatic cells have the capacity to give rise to luminal-like cancer cells.
Extended Data Figure 6
Extended Data Figure 6. Metastatic cells found in different organs show distinct gene expression signatures
a, Supervised clustering of metastatic cells by target organ emphasizes tissue-specific gene signatures. Arrows indicate genes significantly differentially expressed between at least two tissues, as shown in b. b, Box plots show genes most characteristic of each tissue type, as determined by ANOVA and pair-wise analyses. P values and fold change for each gene and tissue pair are listed in Supplementary Table 3. Box plots for all 80 genes differentially expressed between the tissue pairs are shown in Supplementary Data 7. BM, bone marrow; BR, brain; LN, lymph node; LU, lung; PB, peripheral blood (CTC); T, tumour. c, Pearson correlations indicate similarity of CTCs to other metastatic tissue types across all genes analysed. Each dot represents an individual gene. BM, bone marrow; BR, brain; LN, lymph node; LU, lung; PB, peripheral blood (CTC).
Extended Data Figure 7
Extended Data Figure 7. Analysis of dinaciclib-treated animals
a, Immunofluorescence stains for Ki67 in micro- and macrometastatic lesions from low- and high-burden animals, as well as in primary tumours. Scale bars, 50 μm. b, Bar graphs quantify the percentage of MYC, phospho-histone H3 (pH3), and Ki67 positive cells per lesion in micro- and macrometastatic lesions. Error bars represent standard deviation. c, d, Waterfall plots shows the longest final tumour diameter for each PDX animal treated with vehicle (black bars) or drug (white bars). e, Bar graphs show the average number of days to endpoint (4 weeks, or 20 mm primary tumour size) for animals treated with vehicle or drug.
Extended Data Figure 8
Extended Data Figure 8. Model for tumour cell heterogeneity during metastasic progression
a, Metastatic cells from animals with low metastatic burden (blue) are distinct from animals with higher burden, due to their increased expression of stemness, anti-apoptosis, EMT, and dormancy/ quiescence-related genes. In contrast, higher burden metastatic cells are more heterogeneous, and comprise larger numbers of proliferative, differentiated cells (red). Transplant experiments of stem-like metastatic cells showed that they have tumour-initiating potential, and can produce luminal-like cancer cells. This strongly suggests that metastases derive from stem-like cells, which differentiate and undergo a switch from dormancy into proliferation as they colonize and produce more advanced metastatic tumours. Metastatic progression was also associated with increased MYC expression, and could be attenuated with CDK inhibition. We believe this is due to apoptosis of cells as they upregulate MYC, since our previous work has shown that CDK inhibition induces apoptosis in high MYC-expressing cancer cells through synthetic lethality. b, Comparison of gene signatures in primary tumour and metastatic cells showed that 1.4% of primary tumour cells, and 16.7% of CTCs possessed a stem-like signature. This suggests that these cells may be the origin of metastatic tumours.
Figure 1
Figure 1. Single-cell analysis of normal human mammary epithelial cells
a, FACS plots show basal/stem (LinCD49f hiEpCAMlocKit, blue), luminal (LinCD49f loEpCAMhicKit, yellow), and luminal progenitor (LinCD49f med EpCAMmedcKit+, red) cells from a representative mammoplasty patient. Lin =CD45/CD31. b, PCA plots show distinct cell populations identified in three patients. PC, principal component. c, Bar graph shows the 49 of 116 genes that were significantly (P <0.05) differentially expressed between the populations. P values and fold change are listed in Supplementary Table 2. B, basal/stem; LP, luminal progenitor; L, luminal. d, Heatmap and dendrogram show unsupervised hierarchical clustering of individual cells and genes from the 49-gene signature that were run on all arrays.
Figure 2
Figure 2. Identification of human metastatic cells in PDX mice
a, FACS plots show human (h)CD298+ (red), mouse (m)MHC I+ (blue), and double-negative (black) cells in representative tissues (n =3). b, FACS plots show percentage or number of hCD298+mLin (mTer119/mCD45/mCD31) cells in representative low- and high-burden mice. c, Haematoxylin and eosin stains show micro- and macrometastatic lesions in lung tissues of low- and high-burden mice. Low-burden scale bar, 100 μm; high-burden scale bar, 200 μm. Arrows indicate micrometastatic lesions. d, Histograms show the distribution of metastatic burden in each model. Only animals with metastases are s hown. Red arrows indicate animals subjected to single-cell analysis. BM, bone marrow; LN, lymph node; PB, peripheral blood.
Figure 3
Figure 3. Early stage metastatic cells possess a distinct basal/stem-cell program
a, PCA plots show metastatic and primary tumour cells in representative mice. Low, high and intermediate indicate burden levels. b, Bar graph shows genes from the 49-gene differentiation signature, and pluripotency genes, that were differentially expressed in low-burden metastatic cells. *P <0.05, significant relative to primary tumour; primary tumour expression =0. P values and fold change are listed in Extended Data Table 2. Mets, metastases. c, Heatmap and dendrogram show unsupervised hierarchical clustering of metastatic cells and genes from the 49-gene signature that were run on all arrays. BM, bone marrow; BR, brain; LN, lymph node; LU, lung; PB, peripheral blood; T, tumour.
Figure 4
Figure 4. Metastatic progression is blocked by cell cycle inhibition
a, Schematic of the cell cycle. b, Graph and box plot (MYC) show expression for dormancy and cell-cycle-associated genes. P values: MYC: 1.9 ×10⁻¹³; CDK2: 1.25 ×10⁻⁷; CD24: 0.005; MMP1: 1.08 ×10⁻¹²; TGFB2: 1.28 ×10⁻¹⁶; CDKN1B: 2.63 ×10⁻¹⁴; CHEK1: 2.18 ×10⁻⁶. c, Unsupervised hierarchical clustering of metastatic cells and cell-cycle-associated genes. mets, metastases. d, Immunofluorescence stains for MYC and phospho-histone H3 (pH3) in micro- and macrometastatic lesions. Scale bar, 50 μm. e, Dinaciclib treatment course in PDX mice (top). Graphs show percentage of mice with metastasis, and burden per animal. Error bars, s.d. Only one drug-treated animal developed metastasis, so no P value was generated (right graph).

References

    1. Weigelt B, Peterse JL, van’t Veer LJ. Breast cancer metastasis: markers and models. Nature Rev Cancer. 2005;5:591–602. - PubMed
    1. Oskarsson T, Batlle E, Massagué J. Metastatic stem cells: sources, niches, and vital pathways. Cell Stem Cell. 2014;14:306–321. - PMC - PubMed
    1. Hermann PC, et al. Distinct populations of cancer stem cells determine tumor growth and metastatic activity in human pancreatic cancer. Cell Stem Cell. 2007;1:313–323. - PubMed
    1. Pang R, et al. A subpopulation of CD26+ cancer stem cells with metastatic capacity in human colorectal cancer. Cell Stem Cell. 2010;6:603–615. - PubMed
    1. Dieter SM, et al. Distinct types of tumor-initiating cells form human colon cancer tumors and metastases. Cell Stem Cell. 2011;9:357–365. - PubMed

Publication types

MeSH terms

Substances

Associated data