Multicenter Study
. 2015 Oct 8;526(7572):253-7.
doi: 10.1038/nature15390. Epub 2015 Sep 30.

A novel locus of resistance to severe malaria in a region of ancient balancing selection

Collaborators
Multicenter Study

A novel locus of resistance to severe malaria in a region of ancient balancing selection

Malaria Genomic Epidemiology Network et al. Nature. .

Abstract

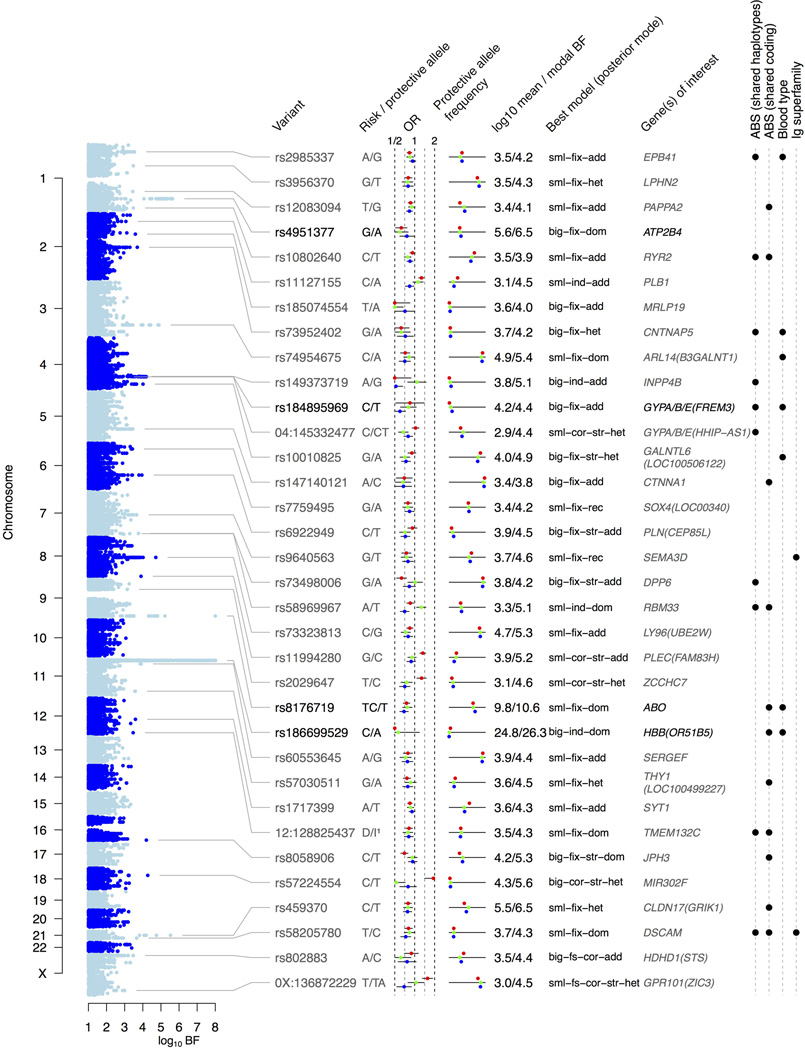
The high prevalence of sickle haemoglobin in Africa shows that malaria has been a major force for human evolutionary selection, but surprisingly few other polymorphisms have been proven to confer resistance to malaria in large epidemiological studies. To address this problem, we conducted a multi-centre genome-wide association study (GWAS) of life-threatening Plasmodium falciparum infection (severe malaria) in over 11,000 African children, with replication data in a further 14,000 individuals. Here we report a novel malaria resistance locus close to a cluster of genes encoding glycophorins that are receptors for erythrocyte invasion by P. falciparum. We identify a haplotype at this locus that provides 33% protection against severe malaria (odds ratio = 0.67, 95% confidence interval = 0.60-0.76, P value = 9.5 × 10(-11)) and is linked to polymorphisms that have previously been shown to have features of ancient balancing selection, on the basis of haplotype sharing between humans and chimpanzees. Taken together with previous observations on the malaria-protective role of blood group O, these data reveal that two of the strongest GWAS signals for severe malaria lie in or close to genes encoding the glycosylated surface coat of the erythrocyte cell membrane, both within regions of the genome where it appears that evolution has maintained diversity for millions of years. These findings provide new insights into the host-parasite interactions that are critical in determining the outcome of malaria infection.


Figures

Extended Data Figure 1
Sample collections included in the study. a) Study sites and ethics approving institutions. b) Phenotypic makeup of discovery and replication samples from each site. ‘UNCOMPLICATED’ refers to case individuals who were not identified as cerebral malaria (CM) or severe malarial anaemia (SMA) cases. ‘BOTH” refers to individuals who have both CM and SMA phenotypes. c) Overall sample counts and number of samples excluded by each QC criterion. (*) denotes the number of samples removed after explicitly including samples with low heterozygosity in Gambia. (†) The Kenyan cohort included parents of a subset of case samples; these were not used in subsequent analyses. d) Plots of average genome-wide heterozygosity and missingness with outliers coloured, as output by the ABERRANT algorithm.
Extended Data Figure 2
Genotyped SNP quality control (QC) for the 3 discovery cohorts. a,b) Total numbers of pre- and post-QC SNPs on a) the autosomes and b) the X chromosome, and numbers of SNPs excluded by each QC criteria. MAF refers to minor allele frequency, HWE to Hardy-Weinberg equilibrium, Plate to the plate test of association and Diff. to the test of difference in frequency between males and females. Details of QC are given in Methods. c) Plot showing the –log10(P values) for the genotypic association test in the discovery data including the first 5 principal components as covariates. Grey dots show SNPs that are removed due to the QC as defined in Methods. The total fraction of SNPs removed from each cohort is given at the top of the plot.
Extended Data Figure 3
Imputation performance. a,b) Empirical distribution of concordance and accuracy (r2) between typed and re-imputed SNPs in the three discovery cohorts. Solid lines represent SNPs with frequency below 5% and dashed lines represent SNPs with frequency of at least 5%. c) Per-sample concordance and accuracy (type 0 r2) across the whole genome, as estimated by reimputing genotyped SNPs. Values are averaged over imputation chunks. d) Average accuracy between genotype and re-imputed SNPs in each cohort, plotted against frequency, in 1% frequency bins.
Extended Data Figure 4
Top ten principal components (PCs) in a) Gambia, b) Malawi and c) Kenya. Where ethnicity was reported, points are coloured by ethnicity for ethnicities with at least 50 samples. d) Logistic regression P-values and direction of effect for the top ten principal components on Severe Malaria status in each cohort. e) qq-plots for additive model association test P-values in Gambia, Malawi, Kenya, and for fixed-effect meta-analysis. Dashed lines represent the 99% confidence interval computed marginally at each variant. Circles and points represent points lying respectively outside and inside the 99% confidence interval. f) Comparison of association test P-values for logistic regression (SNPTEST, x-axis) and linear mixed model (MMM, y-axis) for Gambia, Malawi, Kenya, and for fixed-effect meta-analysis. Variants in tier 1 are coloured blue, with the lead marker at the FREM3/GYPE region coloured red.
Extended Data Figure 5
Detail of Bayesian analysis of discovery cohorts. a) Visualisation of slices through the combined prior on effect sizes in three cohorts for mode-of-inheritance-specific models. Top row: slices through the prior effect size on Kenya (x-axis) and Malawi (y-axis) for constant effect size in Gambia (panels). Bottom row: slices through the prior effect size on Kenya (x-axis) and Gambia (y-axis) for constant effect size in Malawi (panels). Red lines represent a factor of 10 in the prior density. b) Comparison of BFavg (x-axis) with the minimum fixed-effect meta-analysis P-value minimized across additive, dominant, recessive or heterozygote modes of inheritance (y-axis). Values are plotted on log10 and –log10 scales. Colour indicates the heterogeneity model of the model with the highest posterior weight. c) Sensitivity of BFavg to changes in prior. Plots show BFavg ratio (y-axis) plotted against one-dimensional parameterisations of the prior (x-axis), for the 32 autosomal SNPs in tier 1. Solid lines represent variants with minor allele frequency < 5% averaged across populations, and dashed lines variants with minor allele frequency >= 5%. Black dots indicate the lead marker at the FREM3/GYPE locus. Colour indicates the effect size, mode of inheritance, or heterogeneity model for the model with highest posterior weight under the GWAS prior. Dashed grey vertical lines indicate the x-axis value corresponding to the prior used in the GWAS, and one-half and twice that value. Plots are parameterised by i) the prior standard deviation of the small-effect model keeping the prior standard deviation of the large and small-effect models in the ratio 0.75:0.2; ii-v) the prior weight on additive, dominant, recessive or heterozygote modes of inheritance; vi-x) the prior weight on fixed, correlated, independent, fixed-structured and correlated-structured models. For each parameterisation prior weights on other models are kept in the same relative proportion. For further details see Supplementary Note 4.
Extended Data Figure 6
Strongest regions of association in the Bayesian analysis of the three discovery cohorts. Plot on left shows the log10 model- averaged Bayes Factor (BFavg). Table shows the SNP with the highest BFavg in each region (lead SNP), gene(s) of interest in the region, the model with the highest posterior weight at the lead SNP and its BF. Coloured points indicate the odds ratio (OR) and the protective allele frequency in Gambia (red), Malawi (green) and Kenya (Blue). The right hand columns indicate regions containing shared chimp-human haplotypes or coding SNPs4 (ABPs), blood group genes, or Immunoglobulin superfamily genes.
Extended Data Figure 7
a) Evidence for association at directly-typed SNPs in the FREM3/GYPE, INPP4B and ARL14 regions. b) Posterior probability that variants in the FREM3/GYPE region are causal assuming a single variant in the region is causal, based on the BFavg for typed and imputed variants. Dashed lines indicate the 95% and 99% credible sets. See Figure 1 legend for further details. c) Details of SNPs encoding the common MNS blood groups. Coordinates and alleles are with respect to the NCBI b37 human reference sequence. d) Evidence for possible independence of effects at the FREM3 and INPP4B loci in Kenya by conditional analysis. Y-axis represents -log10(association P-value) conditional on the imputed dosage at rs184895969. Points are coloured by LD with the top SNP rs13103597. e) Forest plot showing sample size, estimated odds ratio and 95% confidence interval for the lead imputed SNP (rs149373719) in INPP4B under an additive model of association. f) Bar plot showing the posterior weight on different models of heterogeneity at rs149373719 under the prior used in the GWAS, assuming an additive model of association. g) Forest plot showing evidence in both discovery and replication samples in the Sequenom data at rs77389579 in INPP4B. See Figure 2 legend for further details.
Extended Data Figure 8
Sequence homology, alignability and structural variation in the glycophorin region. a) co-occurrence of 100-mers (upper triangle) and 25-mers (lower triangle) in the human reference sequence. Each point represents a kmer that maps to the locations indicated by the x and y axis positions, either on the same strand (black points) or opposite strands (red points). Green vertical lines in this and subsequent panels delineate the region of high homology surrounding the three glycophorins. b) the location of the lead GWAS marker, ABPs, and protein-coding genes in the region. c) alignability of the 100-mer at each position of the reference, up to two mismatches. Values are taken from the UCSC genome browser mappability track and averaged over 5kb bins. d) IMPUTE info in Kenya for variants with frequency at least 5%, averaged over 5kb bins. e–f) coverage for samples from YRI and LWK in 1000G Phase 1 carrying esv2662558, carrying esv2668125, or not carrying either deletion, respectively. Coverage for each individual is normalised by the mean coverage for that individual across chromosome 1, and only computed at positions with alignability = 1 for all 100-mers overlapping the position, and for reads with mapping quality at least 20. Values are averaged over 5kb (grey) and 10kb (blue) bins. Three samples with apparently erroneous calls in the 1000G Phase1 genotype release are coloured (NA18519, red; NA19185, yellow; NA19222, green) and assigned to the status indicated by their coverage profile. The bottom row represents a sample of 30 individuals not carrying the deletion selected at random in addition to the two with erroneous genotype calls. Coverage computation was performed using the BAM files available from the 1000G project in October 2014, downloaded from ftp://ftp.1000genomes.ebi.ac.uk/vol1/ftp/data. Four African samples in the Phase 1 release were not assessed because they are not included in this directory.
Extended Data Figure 9
Correlation between the genotypes at SNPs of interest within the GYPE/A/B locus and reported gene transcription levels in samples from the YRI and LWK HapMap cohorts. P values are for a trend test of association where more than one genotype class is present. Only assays targeting the glycophorins, and those with a P-value below 0.05 are shown.
Extended Data Figure 10
Detail of enrichment analysis. a) Red histogram: the empirical distribution of the log10 distance of observed tier 1 loci to the nearest ABP haplotype. Grey histogram: distribution of distances for 10,000 simulated tier 1 sets. b) The log10 distance of tier 1 (filled red circles) and tier 2 (empty circles) loci to the nearest ABP, plotted against their rank in BFavg order (stronger signals have lower rank). Loci are annotated with the nearest gene where a gene exists within the association region. Asterisks denote nearest genes that are also the nearest gene to an ABP shared haplotype. c) Empirical null distribution of the odds ratio for the enrichment of tier 1 loci in the set of genes closest to an ABP shared haplotype, based on 10,000 simulated SNP sets. The red asterisk and text indicate the odds ratio for the observed tier 1 loci. d) Distribution of the proportion of the genome which identifies a given gene as nearest, for genes in or not in the set annotated as nearest an ABP haplotype. Left: distribution of the length of the genome for which the given gene is unambiguously the closest gene. Middle: distribution of the number of SNPs in our study for which the given gene is the closest gene. Right: distribution of the number of SNPs in our study for which the given gene is the nearest gene within a recombination interval of 2.5cM±25kb around the SNP, as used to determine nearest genes to GWAS lead SNPs. e) Empirical P-values for enrichment of ABP haplotypes and coding SNPs in tier 1 and tier 2 GWAS regions. Second column: P-values for enrichment by gene overlap. Third to tenth column: P-values for enrichment by proximity at different length scales. †Results for simulations using SNPs frequency-matched to GWAS tier 1 loci in 1% frequency bins. ††Results for simulations excluding the regions of ABO, HBB, ATP2B4, FREM3, INPP4B, and HHIP-AS1.
Figure 1
Figure 1
Signal of association with severe malaria across the FREM3/GYPE region. a) evidence for association (log10BFavg) in the discovery data. Black plusses denote SNPs that were directly typed, and black triangles denote SNPs selected for typing on the Sequenom platform. Dotted red vertical lines indicate a region of 0.25cM±25kb centred at the lead SNP (rs184895969). Coloured circles denote the correlation (outer circles) and |D’| (inner circles) with rs184895969 in controls, computed from imputed haplotypes. b) Polymorphisms shared between humans and chimpanzees, eQTLs, and previously reported associations with other phenotypes. c,d) Genes in the region and the HapMap combined recombination rate.
Figure 2
Figure 2
Evidence for association at SNPs in the FREM3/GYPE region assuming an additive model of association. a) Forest plot showing sample size, estimated odds ratio and 95% confidence interval for the lead imputed SNP in each population and under fixed-effect meta-analysis. The frequency of the protective allele in controls in each population is shown to the right. b) The posterior weight on different models of heterogeneity at rs184895969 under the prior used in the GWAS. Model names are described in Methods. c) Forest plot for the Sequenom-typed SNP rs186873296 in discovery and replication samples, with fixed-effect meta-analysis across all populations and across East African populations (here taken as Kenya, Malawi, Tanzania and Cameroon.)
Figure 3
Figure 3
Haplotype analysis across the FREM3/GYPE region. Left hand panel shows haplotypes at 7321 polymorphic SNPs between 144.5Mb and 145.2Mb on chromosome 4 in the LWK and YRI samples of the 1000 Genomes reference panel. Key variants (Methods and Supplementary Note 2) are enlarged for clarity and labelled, with reference and non-reference alleles coloured blue and yellow respectively. On the right is the estimated topology of the genealogical tree at rs184895969. Dots indicate the position of the inferred protective mutation in Kenya and the branch ancestral to the ABPs, and are labelled with the estimated odds ratios (OR).

Comment in

References

    1. MalariaGEN. Reappraisal of known malaria resistance loci in a large multi-centre study. Nature genetics. 2014 - PMC - PubMed
    1. Timmann C, et al. Genome-wide association study indicates two novel resistance loci for severe malaria. Nature. 2012 - PubMed
    1. Band G, et al. Imputation-based meta-analysis of severe malaria in three African populations. PLoS genetics. 2013;9:e1003509. - PMC - PubMed
    1. Leffler EM, et al. Multiple instances of ancient balancing selection shared between humans and chimpanzees. Science. 2013;339:1578–1582. - PMC - PubMed
    1. Fry AE, et al. Common variation in the ABO glycosyltransferase is associated with susceptibility to severe Plasmodium falciparum malaria. Human molecular genetics. 2008;17:567–576. - PMC - PubMed

Publication types

MeSH terms