

Quantitative analysis of the murine lipid droplet-associated proteome during diet-induced hepatic steatosis
- PMID: 26416795
- PMCID: PMC4655982
- DOI: 10.1194/jlr.M056812
Quantitative analysis of the murine lipid droplet-associated proteome during diet-induced hepatic steatosis
Abstract
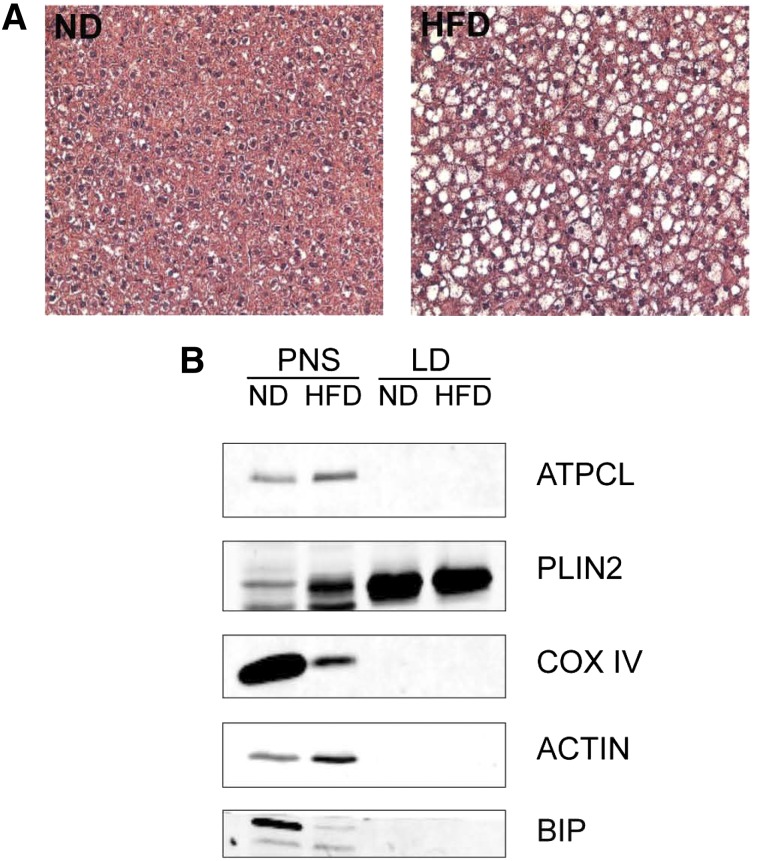
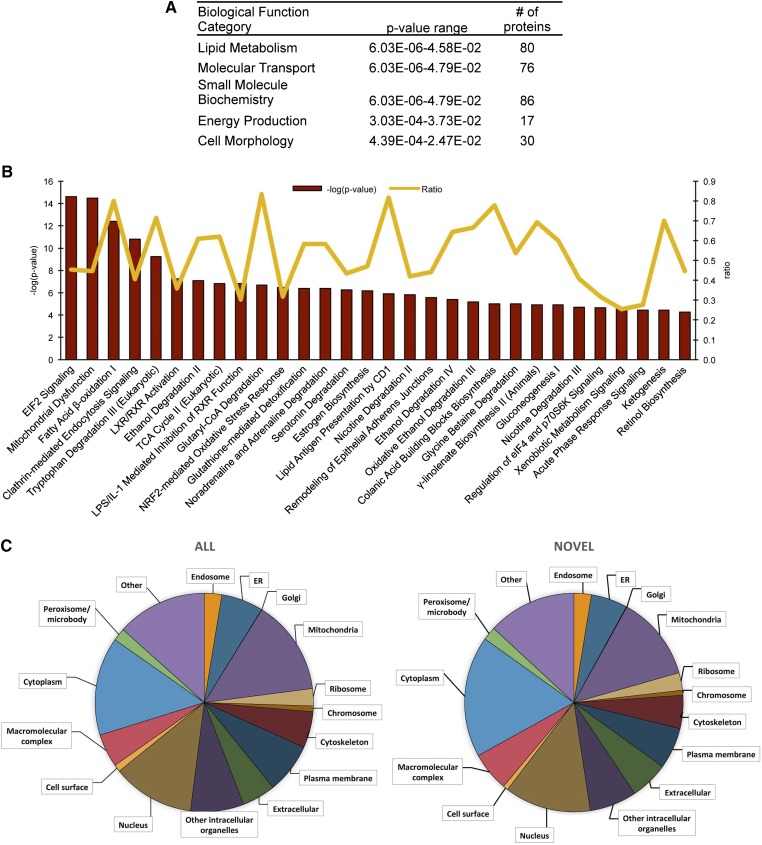
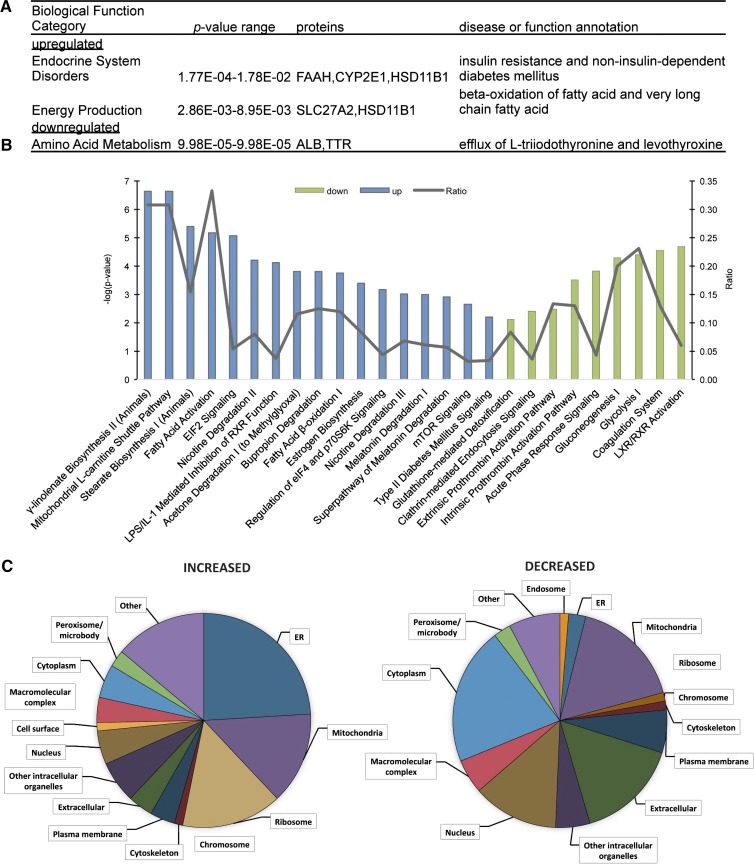
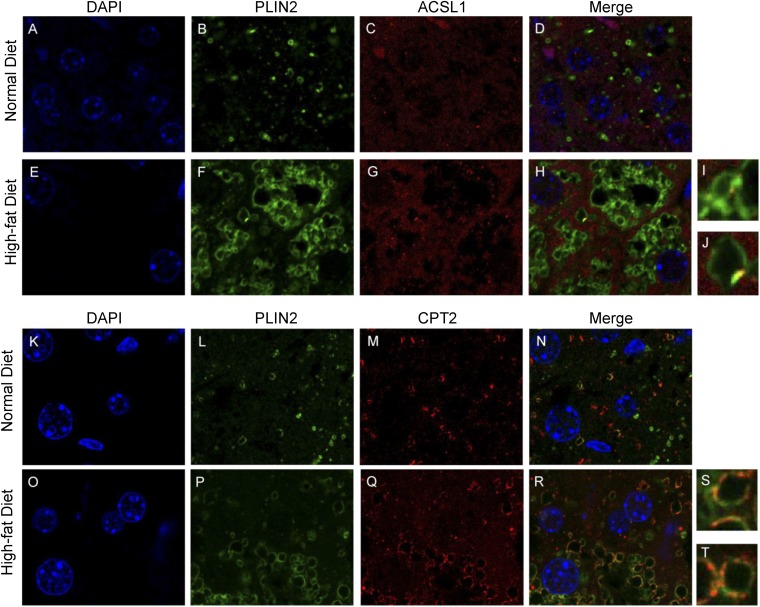
Hepatic steatosis is characterized by the accumulation of lipid droplets (LDs), which are composed of a neutral lipid core surrounded by a phospholipid monolayer embedded with many proteins. Although the LD-associated proteome has been investigated in multiple tissues and organisms, the dynamic changes in the murine LD-associated proteome in response to obesity and hepatic steatosis have not been studied. We characterized the hepatic LD-associated proteome of C57BL/6J male mouse livers following high-fat feeding using isobaric tagging for relative and absolute quantification. Of the 1,520 proteins identified with a 5% local false discovery rate, we report a total of 48 proteins that were increased and 52 proteins that were decreased on LDs in response to high-fat feeding. Most notably, ribosomal and endoplasmic reticulum proteins were increased and extracellular and cytosolic proteins were decreased in response to high-fat feeding. Additionally, many proteins involved in fatty acid catabolism or xenobiotic metabolism were enriched in the LD fraction following high-fat feeding. In contrast, proteins involved in glucose metabolism and liver X receptor or retinoid X receptor activation were decreased on LDs of high-fat-fed mice. This study provides insights into unique biological functions of hepatic LDs under normal and steatotic conditions.
Keywords: liver; nutrition; obesity; proteomics; β-oxidation.
Copyright © 2015 by the American Society for Biochemistry and Molecular Biology, Inc.
Figures
References
-
- Milić S., and Štimac D.. 2012. Nonalcoholic fatty liver disease/steatohepatitis: epidemiology, pathogenesis, clinical presentation and treatment. Dig. Dis. 30: 158–162. - PubMed
-
- Williams K. H., Shackel N. A., Gorrell M. D., McLennan S. V., and Twigg S. M.. 2013. Diabetes and nonalcoholic fatty liver disease: a pathogenic duo. Endocr. Rev. 34: 84–129. - PubMed
-
- Duan X-Y., Zhang L., Fan J-G., and Qiao L.. 2014. NAFLD leads to liver cancer: do we have sufficient evidence? Cancer Lett. 345: 230–234. - PubMed
-
- Adams L. A., Waters O. R., Knuiman M. W., Elliott R. R., and Olynyk J. K.. 2009. NAFLD as a risk factor for the development of diabetes and the metabolic syndrome: an eleven-year follow-up study. Am. J. Gastroenterol. 104: 861–867. - PubMed
-
- Bhatia L. S., Curzen N. P., Calder P. C., and Byrne C. D.. 2012. Non-alcoholic fatty liver disease: a new and important cardiovascular risk factor? Eur. Heart J. 33: 1190–1200. - PubMed
Publication types
MeSH terms
Substances
Grants and funding
LinkOut - more resources
Full Text Sources
Medical
Research Materials
