

Isolation site influences virulence phenotype of serotype 14 Streptococcus pneumoniae strains belonging to multilocus sequence type 15
- PMID: 26416904
- PMCID: PMC4645380
- DOI: 10.1128/IAI.01081-15
Isolation site influences virulence phenotype of serotype 14 Streptococcus pneumoniae strains belonging to multilocus sequence type 15
Abstract
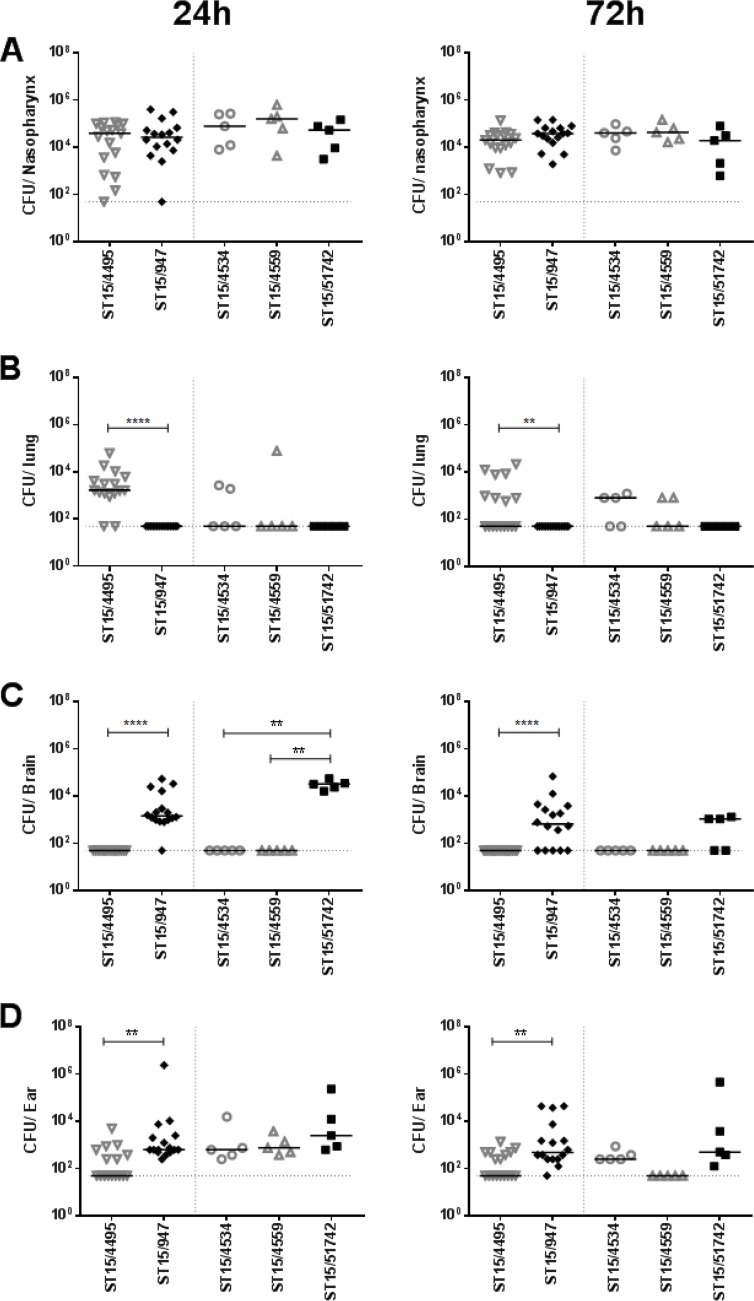
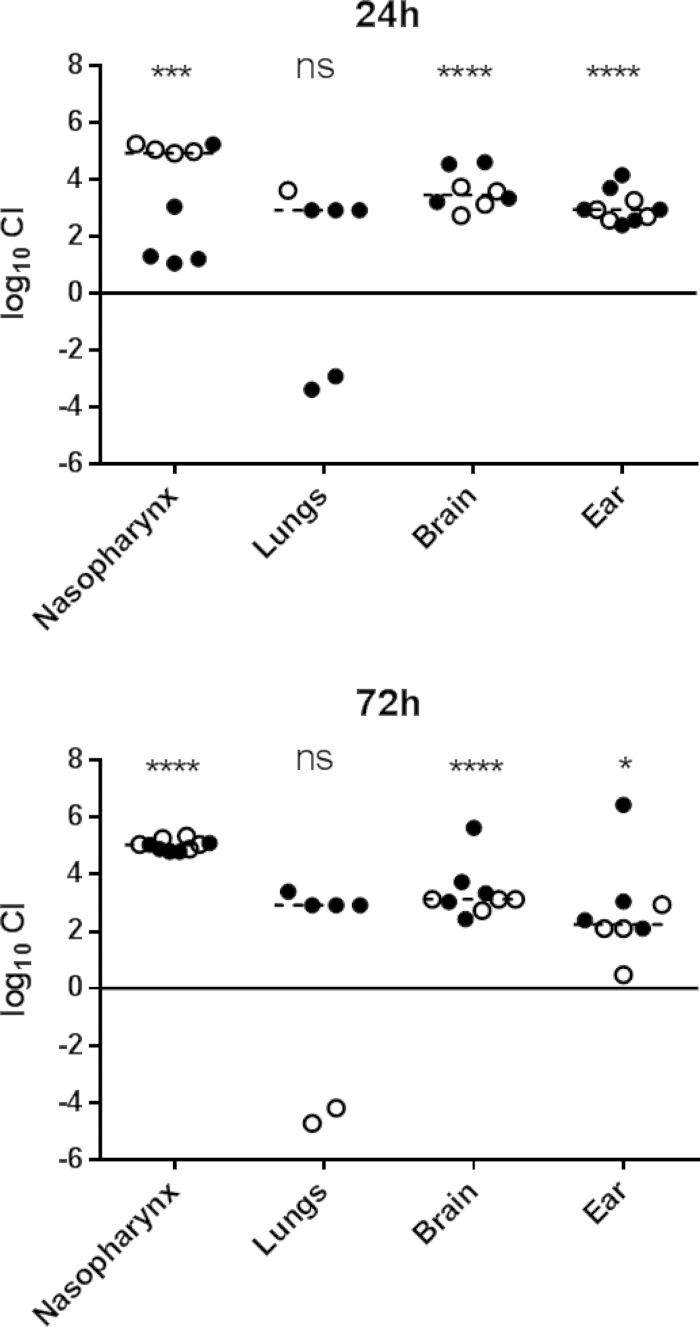
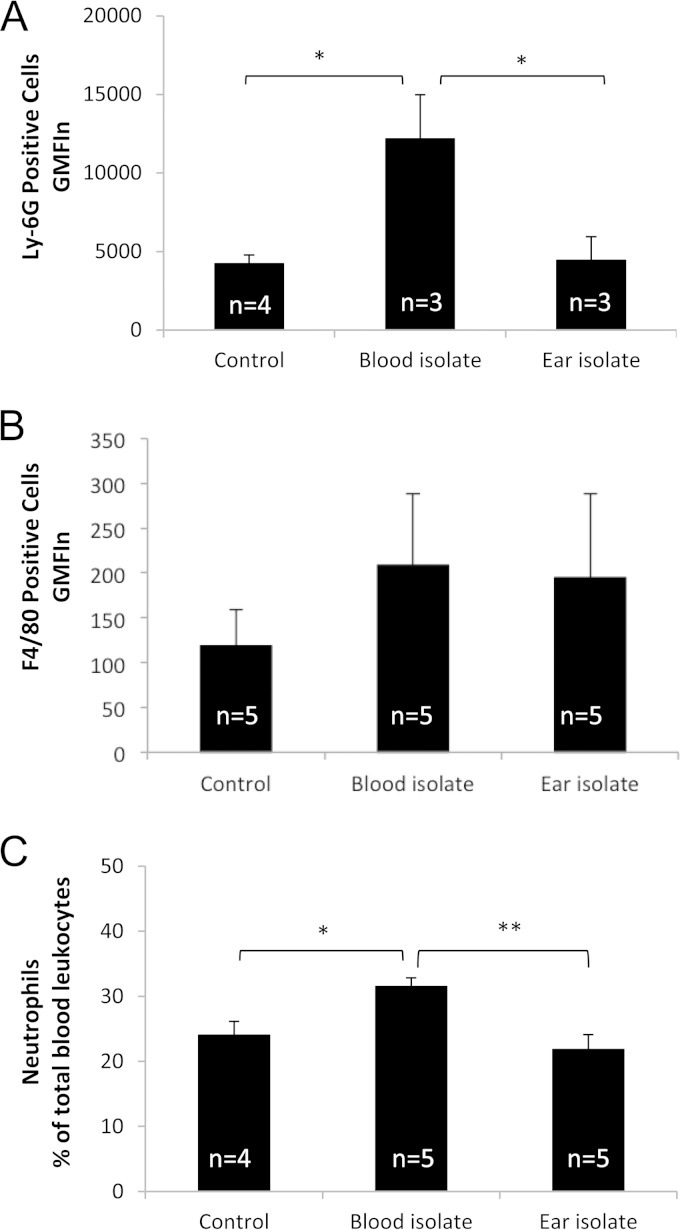
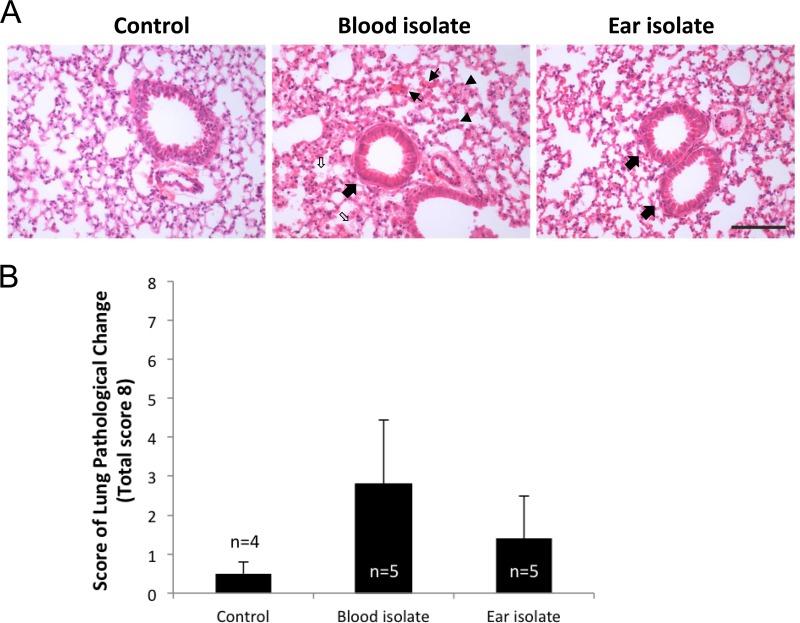
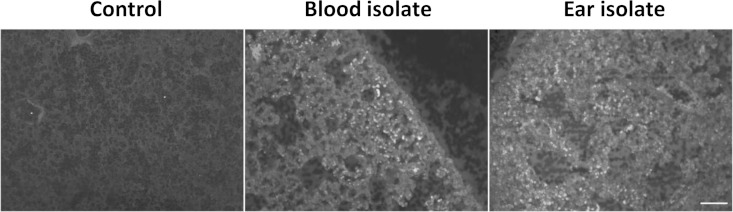
Streptococcus pneumoniae is a diverse species causing invasive as well as localized infections that result in massive global morbidity and mortality. Strains vary markedly in pathogenic potential, but the molecular basis is obscured by the diversity and plasticity of the pneumococcal genome. We have previously reported that S. pneumoniae serotype 3 isolates belonging to the same multilocus sequence type (MLST) differed markedly in in vitro and in vivo phenotypes, in accordance with the clinical site of isolation, suggesting stable niche adaptation within a clonal lineage. In the present study, we have extended our analysis to serotype 14 clinical isolates from cases of sepsis or otitis media that belong to the same MLST (ST15). In a murine intranasal challenge model, five ST15 isolates (three from blood and two from ears) colonized the nasopharynx to similar extents. However, blood and ear isolates exhibited significant differences in bacterial loads in other host niches (lungs, ear, and brain) at both 24 and 72 h postchallenge. In spite of these differences, blood and ear isolates were present in the lungs at similar levels at 6 h postchallenge, suggesting that early immune responses may underpin the distinct virulence phenotypes. Transcriptional analysis of lung tissue from mice infected for 6 h with blood isolates versus ear isolates revealed 8 differentially expressed genes. Two of these were exclusively expressed in response to infection with the ear isolate. These results suggest a link between the differential capacities to elicit early innate immune responses and the distinct virulence phenotypes of clonally related S. pneumoniae strains.
Copyright © 2015, American Society for Microbiology. All Rights Reserved.
Figures
Similar articles
-
Capacity To Utilize Raffinose Dictates Pneumococcal Disease Phenotype.mBio. 2019 Jan 15;10(1):e02596-18. doi: 10.1128/mBio.02596-18. mBio. 2019. PMID: 30647157 Free PMC article.
-
Site of isolation determines biofilm formation and virulence phenotypes of Streptococcus pneumoniae serotype 3 clinical isolates.Infect Immun. 2013 Feb;81(2):505-13. doi: 10.1128/IAI.01033-12. Epub 2012 Dec 3. Infect Immun. 2013. PMID: 23208608 Free PMC article.
-
Comparison of specific in-vitro virulence gene expression and innate host response in locally invasive vs colonizer strains of Streptococcus pneumoniae.Med Microbiol Immunol. 2021 Jun;210(2-3):111-120. doi: 10.1007/s00430-021-00701-w. Epub 2021 Mar 22. Med Microbiol Immunol. 2021. PMID: 33751214
-
Streptococcus pneumoniae: Invasion and Inflammation.Microbiol Spectr. 2019 Mar;7(2):10.1128/microbiolspec.gpp3-0004-2018. doi: 10.1128/microbiolspec.GPP3-0004-2018. Microbiol Spectr. 2019. PMID: 30873934 Free PMC article. Review.
-
Pathogenesis of pneumococcal inflammation: otitis media.Vaccine. 2000 Dec 8;19 Suppl 1:S38-40. doi: 10.1016/s0264-410x(00)00276-0. Vaccine. 2000. PMID: 11163461 Review.
Cited by
-
Streptococcus pneumoniae Strains Isolated From a Single Pediatric Patient Display Distinct Phenotypes.Front Cell Infect Microbiol. 2022 Mar 31;12:866259. doi: 10.3389/fcimb.2022.866259. eCollection 2022. Front Cell Infect Microbiol. 2022. PMID: 35433506 Free PMC article.
-
Uncovering the link between the SpnIII restriction modification system and LuxS in Streptococcus pneumoniae meningitis isolates.Front Cell Infect Microbiol. 2023 May 1;13:1177857. doi: 10.3389/fcimb.2023.1177857. eCollection 2023. Front Cell Infect Microbiol. 2023. PMID: 37197203 Free PMC article.
-
Capacity To Utilize Raffinose Dictates Pneumococcal Disease Phenotype.mBio. 2019 Jan 15;10(1):e02596-18. doi: 10.1128/mBio.02596-18. mBio. 2019. PMID: 30647157 Free PMC article.
-
Genomic, Phenotypic, and Virulence Analysis of Streptococcus sanguinis Oral and Infective-Endocarditis Isolates.Infect Immun. 2018 Dec 19;87(1):e00703-18. doi: 10.1128/IAI.00703-18. Print 2019 Jan. Infect Immun. 2018. PMID: 30396893 Free PMC article.
References
-
- O'Brien KL, Wolfson LJ, Watt JP, Henkle E, Deloria-Knoll M, McCall N, Lee E, Mulholland K, Levine OS, Cherian T, Hib and Pneumococcal Global Burden of Disease Study Team . 2009. Burden of disease caused by Streptococcus pneumoniae in children younger than 5 years: global estimates. Lancet 374:893–902. doi:10.1016/S0140-6736(09)61204-6. - DOI - PubMed
-
- Crook DW, Brueggemann AB, Sleeman KL, Peto TEA. 2004. Pneumococcal carriage, p 136–147. In Tuomanen EI, Mitchell TJ, Morrison DA (ed), The pneumococcus. ASM Press, Washington, DC.
Publication types
MeSH terms
LinkOut - more resources
Full Text Sources
Medical
