. 2015 Sep 28;210(7):1101-15.
doi: 10.1083/jcb.201504047.

PDK2-mediated alternative splicing switches Bnip3 from cell death to cell survival

Affiliations

PDK2-mediated alternative splicing switches Bnip3 from cell death to cell survival

Hongying Gang et al. J Cell Biol. .

Abstract

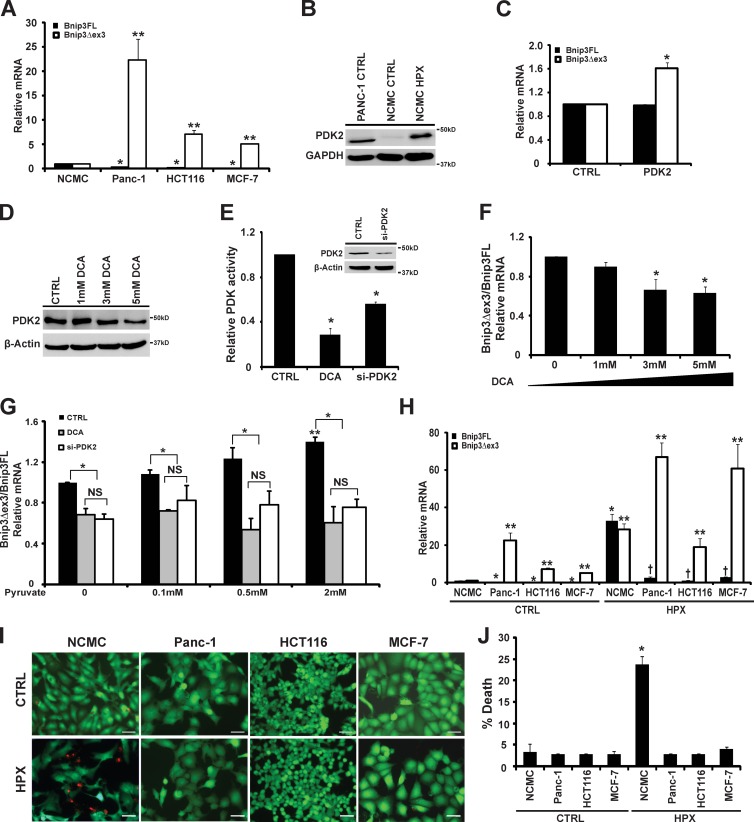
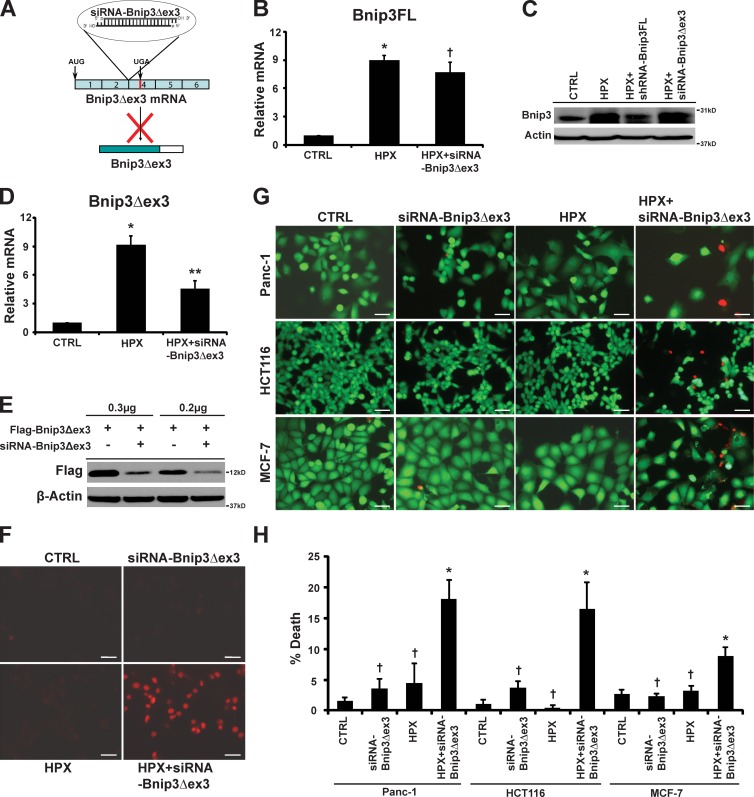
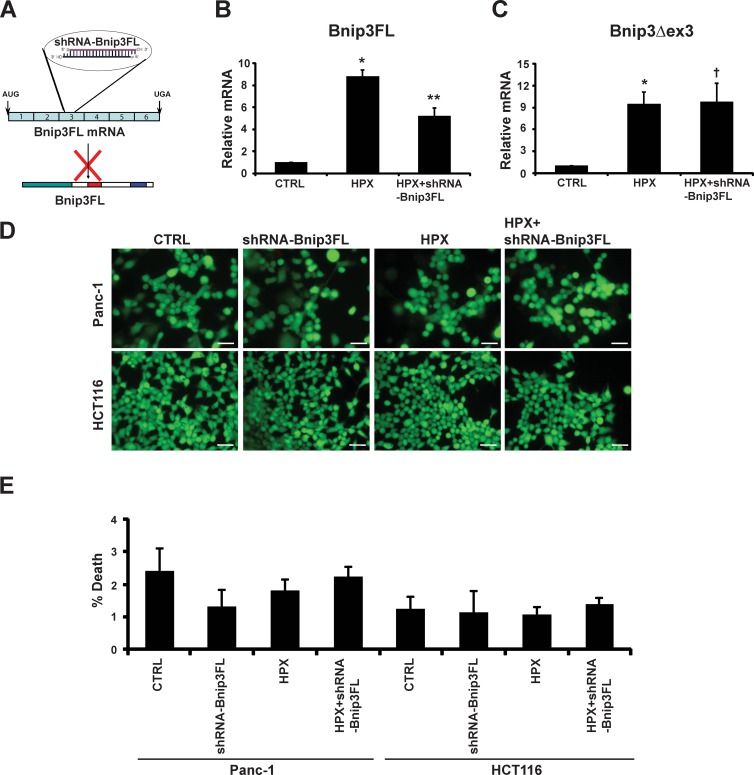
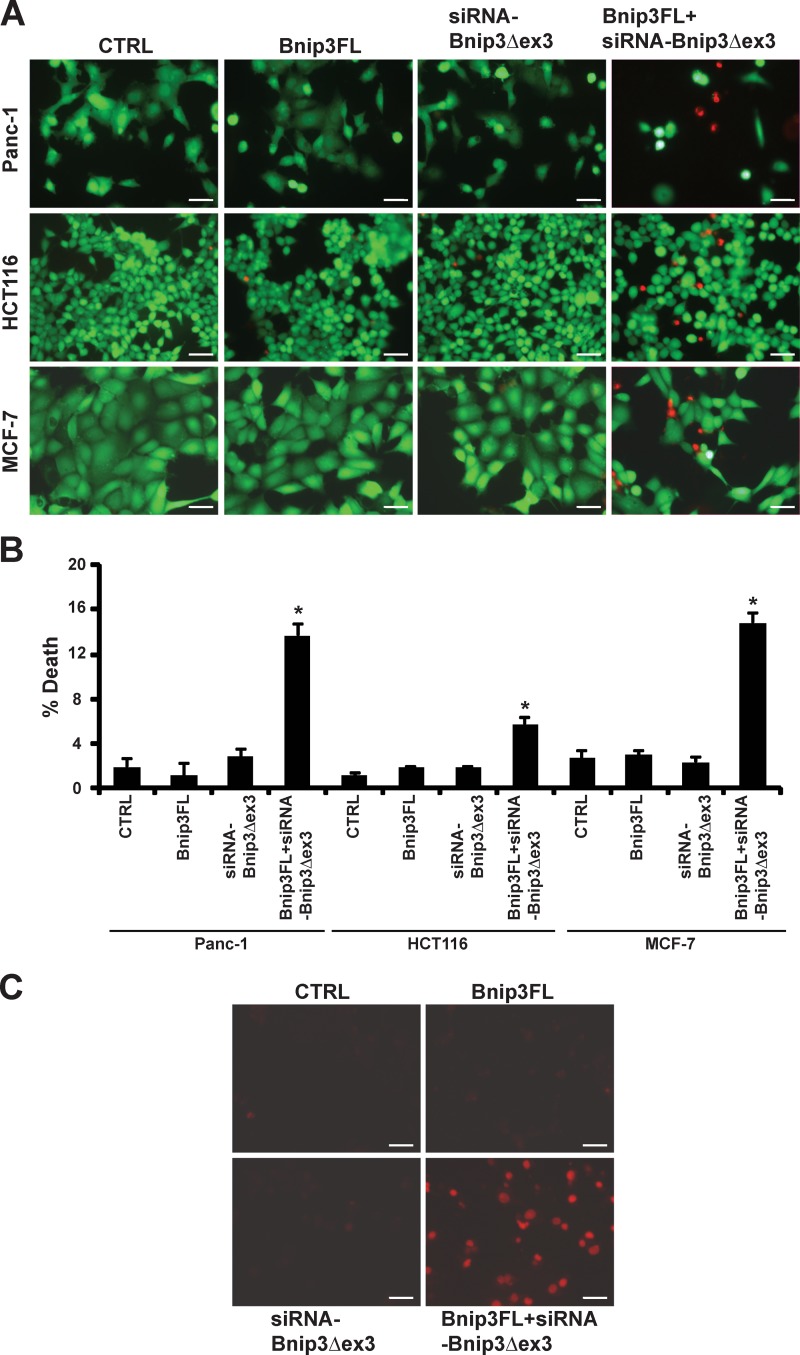
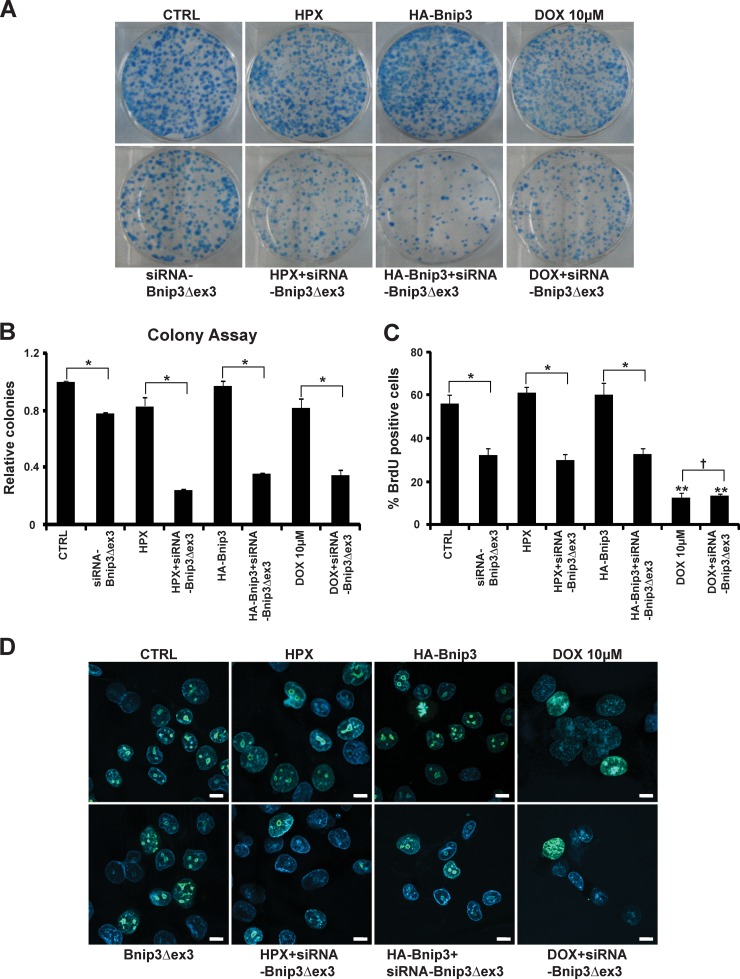
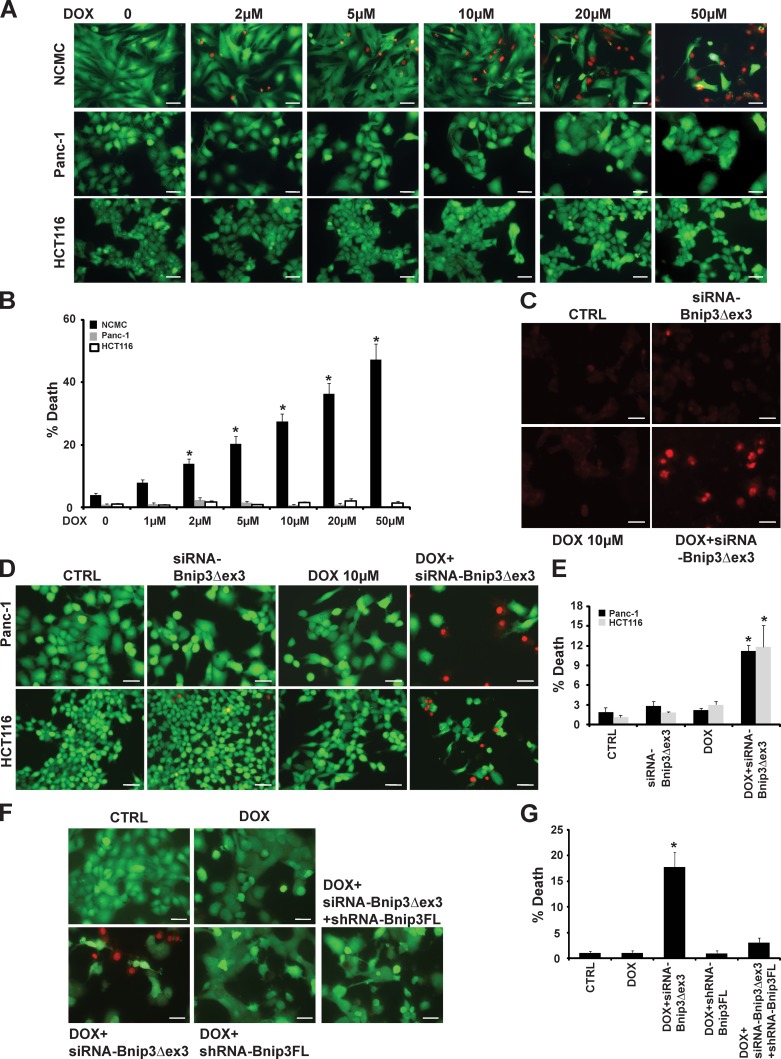
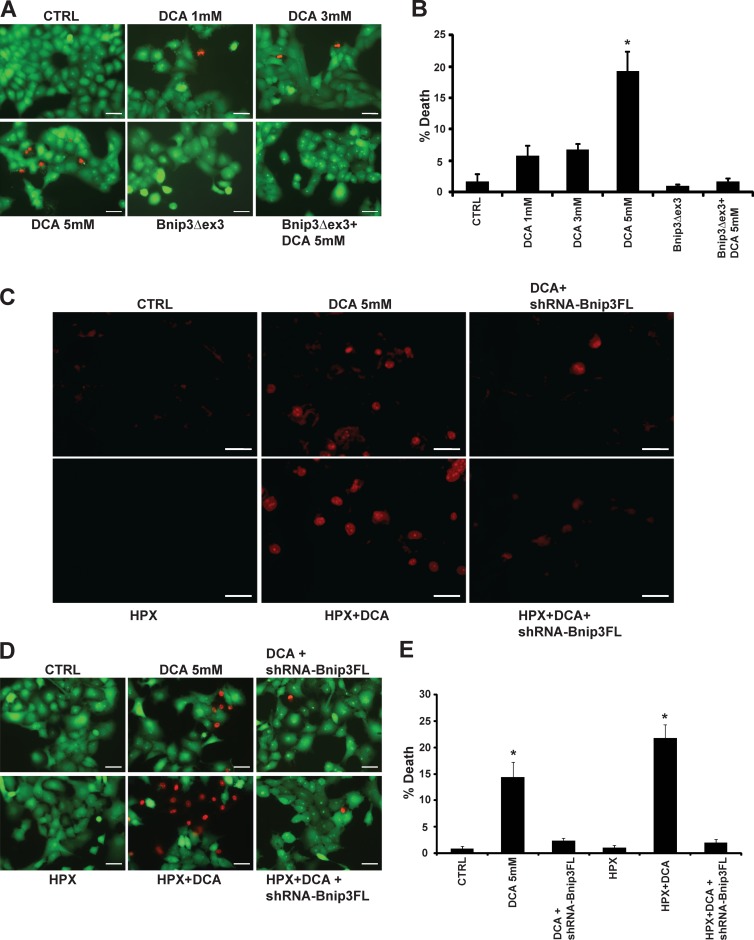
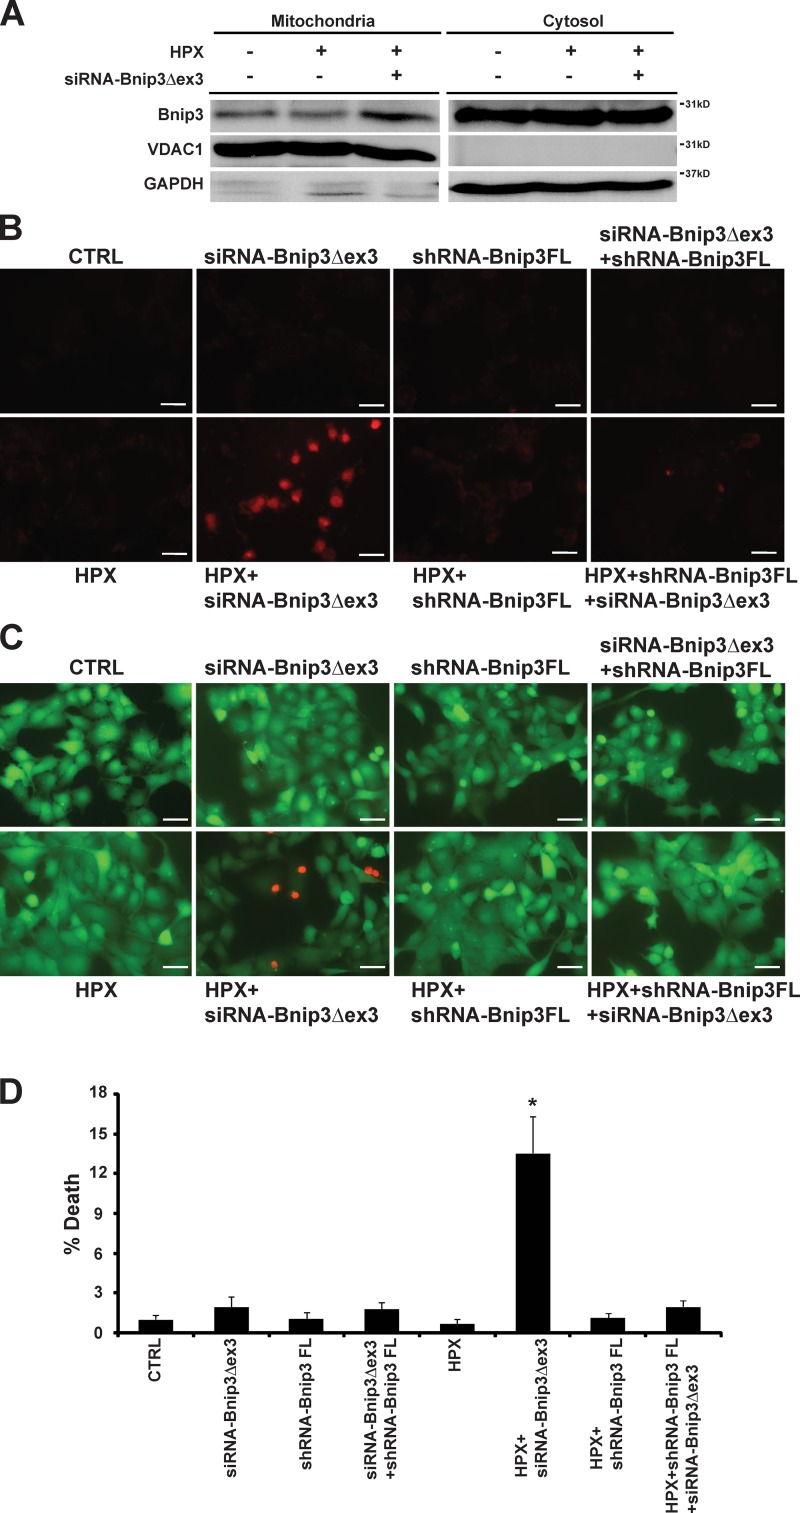
Herein we describe a novel survival pathway that operationally links alternative pre-mRNA splicing of the hypoxia-inducible death protein Bcl-2 19-kD interacting protein 3 (Bnip3) to the unique glycolytic phenotype in cancer cells. While a full-length Bnip3 protein (Bnip3FL) encoded by exons 1-6 was expressed as an isoform in normal cells and promoted cell death, a truncated spliced variant of Bnip3 mRNA deleted for exon 3 (Bnip3Δex3) was preferentially expressed in several human adenocarcinomas and promoted survival. Reciprocal inhibition of the Bnip3Δex3/Bnip3FL isoform ratio by inhibiting pyruvate dehydrogenase kinase isoform 2 (PDK2) in Panc-1 cells rapidly induced mitochondrial perturbations and cell death. The findings of the present study reveal a novel survival pathway that functionally couples the unique glycolytic phenotype in cancer cells to hypoxia resistance via a PDK2-dependent mechanism that switches Bnip3 from cell death to survival. Discovery of the survival Bnip3Δex3 isoform may fundamentally explain how certain cells resist Bnip3 and avert death during hypoxia.


Figures

Figure 1.
Figure 1.
Alternative splicing of Bnip3 in cancer cells. (A) Endogenous mRNA levels of Bnip3 full length (Bnip3FL) and Bnip3 spliced variant deleted for exon 3 (Bnip3Δex3) by qPCR in neonatal cardiac myocytes (NCMC), Panc-1, HCT-116, and MCF-7 cells. Data were obtained from at least n = 4–7 independent experiments for each condition tested. Data are expessed as mean ± SD (error bars). *, statistically different from Bnip3FL of primary NCMC; **, statistically different from Bnip3Δex3 of NCMC. (B) Western blot analysis of endogenous PDK2 proteins in Panc-1 cells and NCMC under normoxia and hypoxia conditions. The filter was probed with an antibody directed against PDK2 (46 kD). GAPDH served as a loading control for the Western blot. (C) Endogenous mRNA expression levels of Bnip3FL and Bnip3Δex3 isoforms in NCMC transfected with vector alone control (CTRL) or PDK2 eukaryotic expression plasmid. Data were obtained from at least n = 3 independent experiments for each condition tested. *, statistically different from CTRL. (D) Western blot analysis of endogenous PDK2 protein in Panc-1 cells treated with 1–5 mM DCA. The filter was probed with an antibody directed against PDK2 (46 kD). β-Actin served as a loading control for the Western blot. (E) ELISA for PDK2 kinase activity in Panc-1 cells treated with 5 mM DCA or knocked down for PDK2. Data were obtained from at least n = 4 independent cell culture for each condition tested. *, statistically different from CTRL. (E, inset) Western blot analysis of endogenous PDK2 protein in Panc-1 cells in the absence or presence of siRNA-PDK2. (F) Real-time qPCR analysis of relative Bnip3Δex3 and Bnip3FL mRNA expression levels in Panc-1 cells. Cells were treated with 1–5 mM DCA. Data were obtained from at least n = 3 independent experiments for each condition tested. *, statistically different from CTRL in the absence of DCA. (G) Real-time qPCR analysis of relative Bnip3Δex3 mRNA and Bnip3FL mRNA in Panc-1 cells treated with pyruvate. Panc-1 cells were treated with 5 mM DCA or followed by knockdown of PDK2 with siRNA directed against PDK2 in the absence or presence of 0.1–2 mM pyruvate. Data were obtained from at least n = 3–4 independent cell cultures for each condition tested. *, statistically different from CTRL; NS, not statistically different from each other in the indicated group; **, statistically different from CTRL in the absence of pyruvate. (H) Real-time PCR analysis of Bnip3FL and Bnip3Δex3 isoforms in NCMC, Panc-1, HCT116, and MCF-7 cells subjected to hypoxia (HPX) for 18 h. Data were obtained from at least n = 3–4 independent experiments for each condition tested. *, statistically different from myocytes CTRL for Bnip3FL isoform; †, not statistically different from myocytes CTRL for Bnip3FL isoform; **, statistically different from myocytes CTRL for Bnip3Δex3 isoform. (I) Cell viability of cancer cells during hypoxia; shown are representative epifluorescence images of cells stained with vital dyes calcein-AM and ethidium homodimer-1 to visualize live (green) and dead (red) cells, respectively, as we described previously. Bar, 40 µm. (J) Histogram depicting quantitative data from I. Data were obtained from at least n = 3–4 independent experiments counting ≥500 cells from n = 3 glass coverslips for each condition tested. *, statistically different from myocytes CTRL.
Figure 2.
Figure 2.
Knockdown of Bnip3Δex3 isoform sensitizes cancer cells to hypoxia. (A) Schematic depicting the targeting strategy of siRNA for knockdown of endogenous Bnip3Δex3 isoform. siRNA was designed to specifically target sequences spanning the exon 2–exon 4 junction, which is unique to the Bnip3Δex3 isoform. Specificity of the siRNA was described previously. (B) Real-time qPCR analysis of relative mRNA levels of endogenous Bnip3FL isoform. Panc-1 cells were subjected to hypoxia for 18 h in the absence or presence of siRNA-Bnip3Δex3 (50 nM). RNA extracted from the cells was analyzed by real-time PCR. Data were obtained from at least n = 3–4 independent experiments for each condition tested. Data are expressed as mean ± SD (error bars). *, statistically different from control (CTRL); †, not statistically different from HPX. (C) Western blot analysis of Bnip3 proteins in panc-1 cells in the absence or presence of shRNA-Bnip3FL or siRNA-Bnip3Δex3 under the hypoxia condition; the filter was probed with a murine antibody directed against Bnip3 (∼30 kD). β-Actin (∼40 kD) served as a loading control for the Western blot. (D) Real-time qPCR analysis of relative mRNA levels of endogenous Bnip3Δex3 isoform. Panc-1 cells were subjected to hypoxia for 18 h in the absence or presence of siRNA-Bnip3Δex3 (50 nM). RNA extracted from the cells was analyzed by real-time PCR. Data were obtained from at least n = 3–4 independent experiments for each condition tested. *, statistically different from control (CTRL); **, statistically different from hypoxia (HPX). (E) Western blot analysis of Flag-Bnip3Δex3 expression levels in Panc-1 cells. Panc-1 cells were transfected with Flag-Bnip3Δex3 eukaryotic expression vector in the absence or presence of siRNA-Bnip3Δex3. Bnip3Δex3 was detected with the antibody directed against Flag-tag. (F) ROS in Panc1 cells after Bnip3Δex3 knockdown during hypoxia; ROS production was monitored by dihydroethidium (DHE, red fluorescence) staining. Bars, 40 µm. (G) Cell viability of Panc-1, HCT116, and MCF-7 cells after Bnip3Δex3 knockdown during hypoxia. Cell viability was shown by representative epifluorescence images of cells stained with vital dyes calcein-AM and ethidium homodimer-1 to visualize live (green) and dead (red) cells, respectively. Bars, 40 µm. (H) Histogram for quantitative data shown in E. Data were obtained from at least n = 3–4 independent experiments counting ≥500 cells from n = 3 glass coverslips for each condition tested. *, statistically different from CTRL; †, not statistically different from CTRL.
Figure 3.
Figure 3.
Resistance of cancer cells to Bnip3FL isoform and hypoxia-induced cell death. (A) Schematic depicting the targeting strategy of shRNA for knockdown of endogenous Bnip3FL. shRNA was designed to specifically target sequences within exon 3 of Bnip3FL to knock down Bnip3FL without interfering with Bnip3Δex3, as we have previously reported (Gang et al., 2011). (B and C) Real-time qPCR analysis of Bnip3FL (B) and Bnip3Δex3 (C) mRNA levels in cancer cells. Cells were subjected to hypoxia condition for 18 h in the absence or presence of shRNA-Bnip3FL. Data are expressed as mean ± SD (error bars). *, statistically different from control (CTRL); **, statistically different from HPX; †, not statistically different from HPX. Data were obtained from at least n = 3–4 independent cell cultures for each condition tested. (D) Cell viability of cancer cells after Bnip3FL knockdown with shRNA-Bnip3FL under hypoxic conditions. Shown are representative epifluorescence images of cells stained with vital dyes calcein-AM and ethidium homodimer-1 to visualize live (green) and dead (red) cells, respectively. Bars, 40 µm. (E) Histogram for quantitative data shown in E. Data were obtained from at least n = 3–4 independent cell cultures counting ≥500 cells from n = 3 glass coverslips for each condition tested.
Figure 4.
Figure 4.
Knockdown of Bnip3Δex3 sensitizes cancer cells to Bnip3FL-induced cell death. (A) Cell viability of cancer cells expressing Bnip3FL in the absence and presence of siRNA-Bnip3Δex3. Representative epifluorescence images of various cancer cells stained with vital dyes calcein-AM and ethidium homodimer-1 to visualize live (green) and dead (red) cells, respectively. Bars, 40 µm. (B) Histogram for quantitative data shown in A. Data were obtained from at least n = 3–4 independent cell cultures counting ≥500 cells from n = 3 glass coverslips for each condition tested. *, statistically different from control (CTRL). (C) ROS production in Panc-1 cells (red fluorescence) overexpressing Bnip3FL in the absence and presence of Bnip3Δex3 knockdown with siRNA-Bnip3Δex3. Bars, 40 µm.
Figure 5.
Figure 5.
Colony formation assay, BrdU incorporation, and Ki67 staining in HCT-116 and Panc-1 cancer cells. (A) Colony formation assay in HCT116 cells in the absence and presence of siRNA directed against Bnip3Δex3 isoform subjected to hypoxia, transfected with HA-Bnip3, or treated with doxorubicin (10 µM DOX), respectively. (B) Histogram represents quantitative data for A. Data were obtained from at least n = 3–4 independent experiments for each condition tested. Data are expressed as mean ± SD (error bars). *, statistically different from each other. (C) Quantitative data for BrdU incorporation in Panc-1 cells in the absence and presence of siRNA directed against Bnip3Δex3 isoform subjected to hypoxia, transfected with HA-Bnip3, or treated with doxorubicin (10 µM DOX), respectively. Data were obtained from three independent cell cultures for each condition tested. *, statistically different from each other; **, statistically different from CTRL; †, not statistically different from each other. (D) Epifluorescence microscopy of Panc-1 cells stained for Ki67 protein (green) and Hoechst 33258 nuclear dye (blue). Cells were subjected to hypoxia, transfected with HA-Bnip3, or treated with doxorubicin (10 µM DOX) in the absence and presence of siRNA directed against Bnip3Δex3 isoform. Bars, 10 µm.
Figure 6.
Figure 6.
Knockdown of Bnip3Δex3 promotes cell death induced by doxorubicin. (A) Cell viability of neonatal cardiac myocytes (NCMC), Panc-1, and HCT116 cells treated with different concentrations of doxorubicin for 18 h. Representative epifluorescence images of cells stained with vital dyes calcein AM and ethidium homodimer-1 to visualize live (green) and dead (red) cells, respectively, are shown. Bars, 40 µm. (B) Histogram for quantitative data shown in A. Data were obtained from at least n = 3–4 independent experiments counting ≥500 cells from n = 3 glass coverslips for each condition tested. (C) ROS production by DHE staining in Panc-1 cells treated with DOX (10 µM) for 18 h in the absence or presence of Bnip3Δex3 knockdown with siRNA-Bnip3Δex3. Bars, 40 µm. (D) Cell viability of Panc-1 and HCT-116 cancer cells treated with doxorubicin (10 µM) for 18 h in the absence and presence of Bnip3Δex3 knockdown with siRNA-Bnip3Δex3. Representative epifluorescence images of cells stained with vital dyes calcein AM and ethidium homodimer-1 to visualize live (green) and dead (red) cells, respectively, are shown. Bars, 40 µm. (E) Histogram for quantitative data shown in D. Data were obtained from at least n = 3–4 independent experiments counting ≥500 cells from n = 3 glass coverslips for each condition tested. (F) Cell viability of cancer cells treated with doxorubicin (10 µM) for 18 h in the absence or presence of siRNA-Bnip3Δex3 and shRNA-Bnip3FL, respectively. Representative epifluorescence images of cells stained with vital dyes calcein AM and ethidium homodimer-1 to visualize live (green) and dead (red) cells, respectively, are shown. Bars, 40 µm. (G) Histogram for quantitative data shown in F. Data were obtained from at least n = 3–4 independent experiments counting ≥500 cells from n = 3 glass coverslips for each condition tested. Data are expressed as mean ± SD (error bars). *, statistically different from control (CTRL).
Figure 7.
Figure 7.
Selective knockdown of Bnip3FL rescues cell death induced by DCA. (A) Cell viability of Panc-1 cells expressing Bnip3Δex3 in the absence or presence of 1–5 mM DCA for 24 h. Representative epifluorescence images of cells stained with vital dyes calcein AM and ethidium homodimer-1 to visualize live (green) and dead (red) cells, respectively, are shown. Bars, 40 µm. (B) Histogram for quantitative data shown in A. Data were obtained from at least n = 3–4 independent experiments counting ≥500 cells from n = 3 glass coverslips for each condition tested. (C–E) ROS (C) and cell viability (D and E) of Panc-1 cells treated with 5 mM DCA for 24 h in the absence or presence of shRNA-Bnip3FL during hypoxia. Representative epifluorescence images of cells stained with vital dyes calcein AM and ethidium homodimer to visualize live (green) and dead (red) cells, respectively, are shown. ROS production was monitored by DHE staining. Bars, 40 µm. (E) Histogram for quantitative data shown in D. Data were obtained from at least n = 3–4 independent experiments counting ≥500 cells from n = 3 glass coverslips for each condition tested. Data are expressed as mean ± SD (error bars). *, statistically different from CTRL.
Figure 8.
Figure 8.
Mitochondrial targeting of Bnip3FL isoform in Panc-1 is increased in Panc-1 cells deficient for Bnip3Δex3 variant. (A) Mitochondrial targeting of Bnip3FL is increased in Panc-1 cells during hypoxia after knockdown of Bnip3Δex3 isoform. Western blot analysis of mitochondrial and cytoplasmic fractions under normoxic and hypoxic conditions in the absence and presence of Bnip3Δex3 knockdown is shown; the filter was probed with a murine antibody directed against mitochondrial protein VDAC1, or cytosolic protein GAPDH was used to verify the integrity and purity of the cell fractionation. Bnip3FL was detected with a murine antibody directed against Bnip3. (B) ROS production in panc-1 cells after Bnip3Δex3 knockdown with siRNA-Bnip3Δex3 under hypoxia conditions. Epifluorescence microscopy of Panc-1 cells monitored for ROS production by DHE (red fluorescence). Bars, 40 µm. (C) Cell viability. Representative epifluorescence images of cells stained with vital dyes calcein-AM and ethidium homodimer-1 to visualize live (green) and dead (red) cells for conditions shown in B are shown. Bars, 40 µm. (D) Histogram for quantitative data shown in C. Data were obtained from at least n = 3–4 independent experiments counting ≥500 cells from n = 3 glass coverslips for each condition tested. Data are expressed as mean ± SD (error bars). *, statistically different from control (CTRL).

Similar articles

Cited by

References

    1. Ashwell J.D., Berger N.A., Cidlowski J.A., Lane D.P., and Korsmeyer S.J.. 1994. Coming to terms with death: apoptosis in cancer and immune development. Immunol. Today. 15:147–151. 10.1016/0167-5699(94)90309-3 - DOI - PubMed
    1. Bellot G., Garcia-Medina R., Gounon P., Chiche J., Roux D., Pouysségur J., and Mazure N.M.. 2009. Hypoxia-induced autophagy is mediated through hypoxia-inducible factor induction of BNIP3 and BNIP3L via their BH3 domains. Mol. Cell. Biol. 29:2570–2581. 10.1128/MCB.00166-09 - DOI - PMC - PubMed
    1. Bhandari P., Song M., Chen Y., Burelle Y., and Dorn G.W. II. 2014. Mitochondrial contagion induced by Parkin deficiency in Drosophila hearts and its containment by suppressing mitofusin. Circ. Res. 114:257–265. 10.1161/CIRCRESAHA.114.302734 - DOI - PMC - PubMed
    1. Bonnet S., Archer S.L., Allalunis-Turner J., Haromy A., Beaulieu C., Thompson R., Lee C.T., Lopaschuk G.D., Puttagunta L., Bonnet S., et al. . 2007. A mitochondria-K+ channel axis is suppressed in cancer and its normalization promotes apoptosis and inhibits cancer growth. Cancer Cell. 11:37–51. 10.1016/j.ccr.2006.10.020 - DOI - PubMed
    1. Chiche J., Rouleau M., Gounon P., Brahimi-Horn M.C., Pouysségur J., and Mazure N.M.. 2010. Hypoxic enlarged mitochondria protect cancer cells from apoptotic stimuli. J. Cell. Physiol. 222:648–657. - PubMed

Publication types

MeSH terms

Substances

LinkOut - more resources