. 2015 Sep 28;210(7):1153-64.
doi: 10.1083/jcb.201503066.

mTOR and differential activation of mitochondria orchestrate neutrophil chemotaxis

Affiliations

mTOR and differential activation of mitochondria orchestrate neutrophil chemotaxis

Yi Bao et al. J Cell Biol. .

Abstract

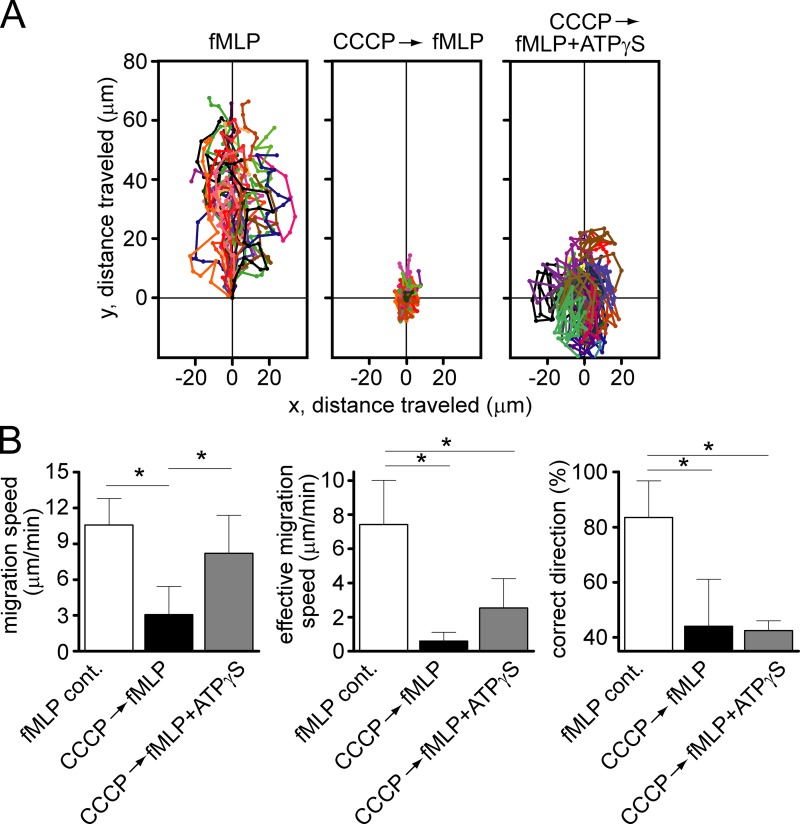
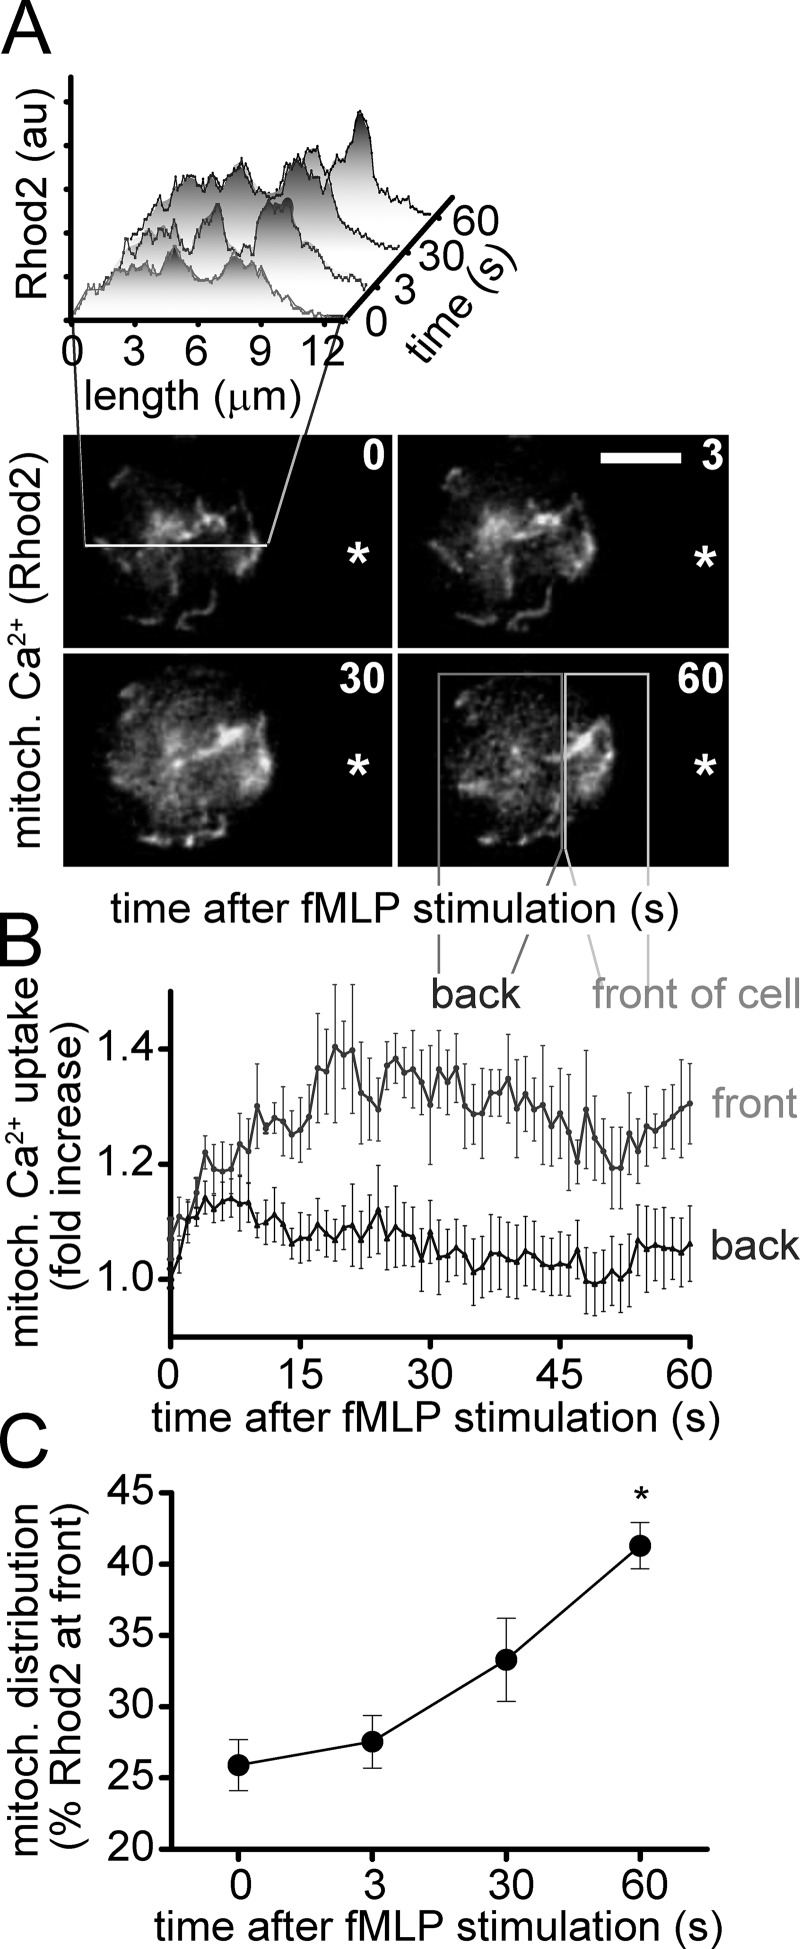
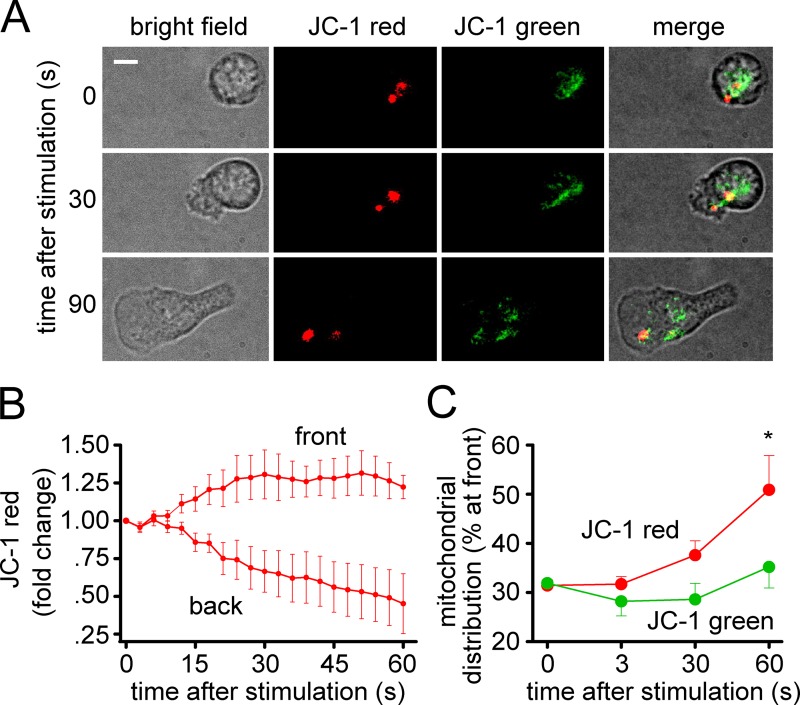
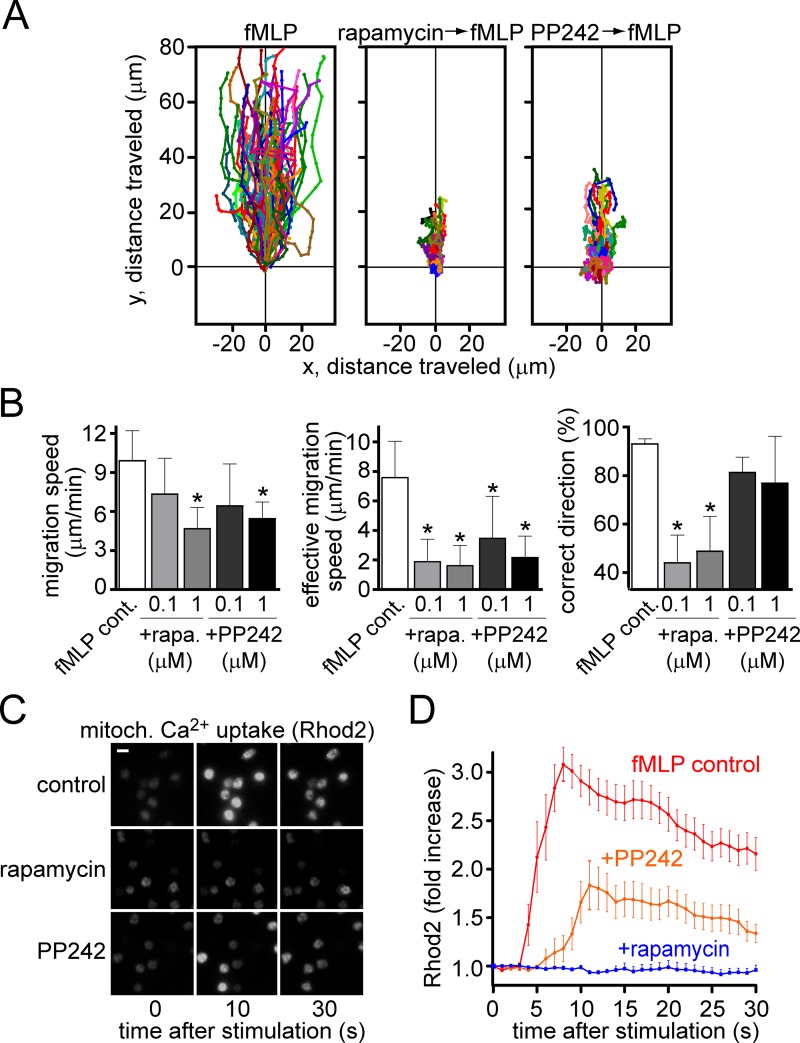
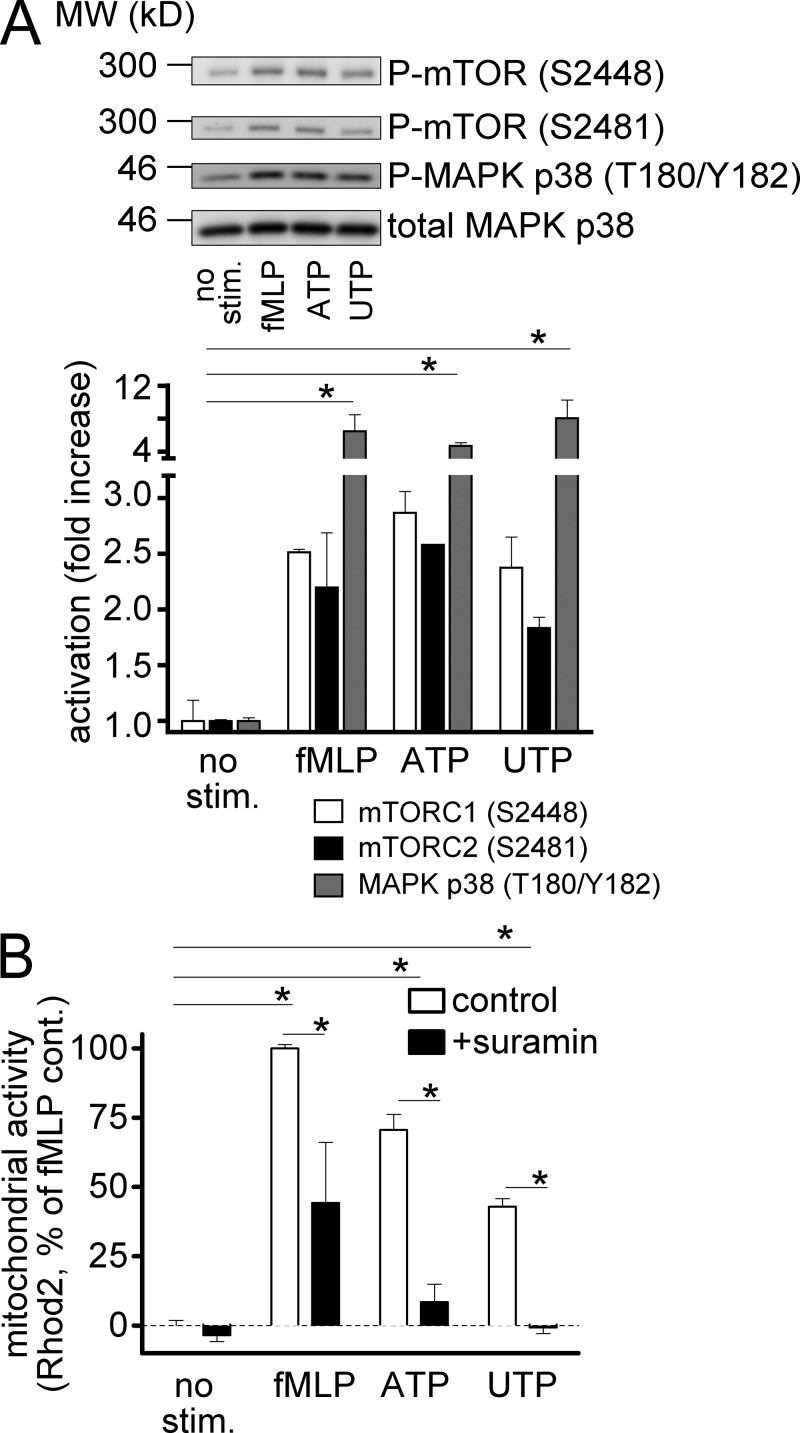
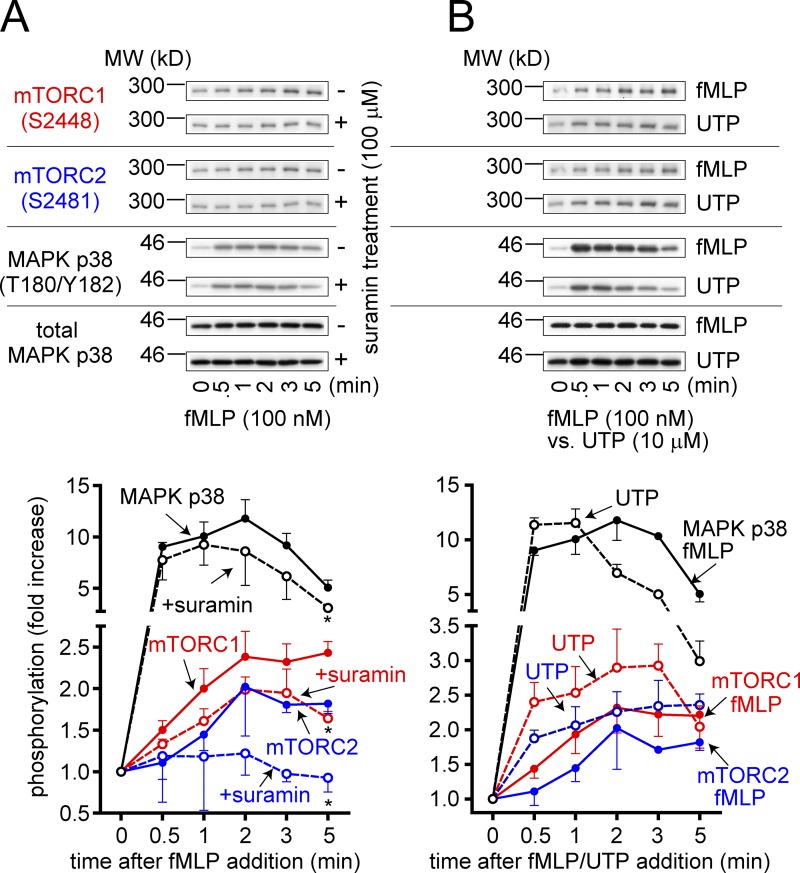
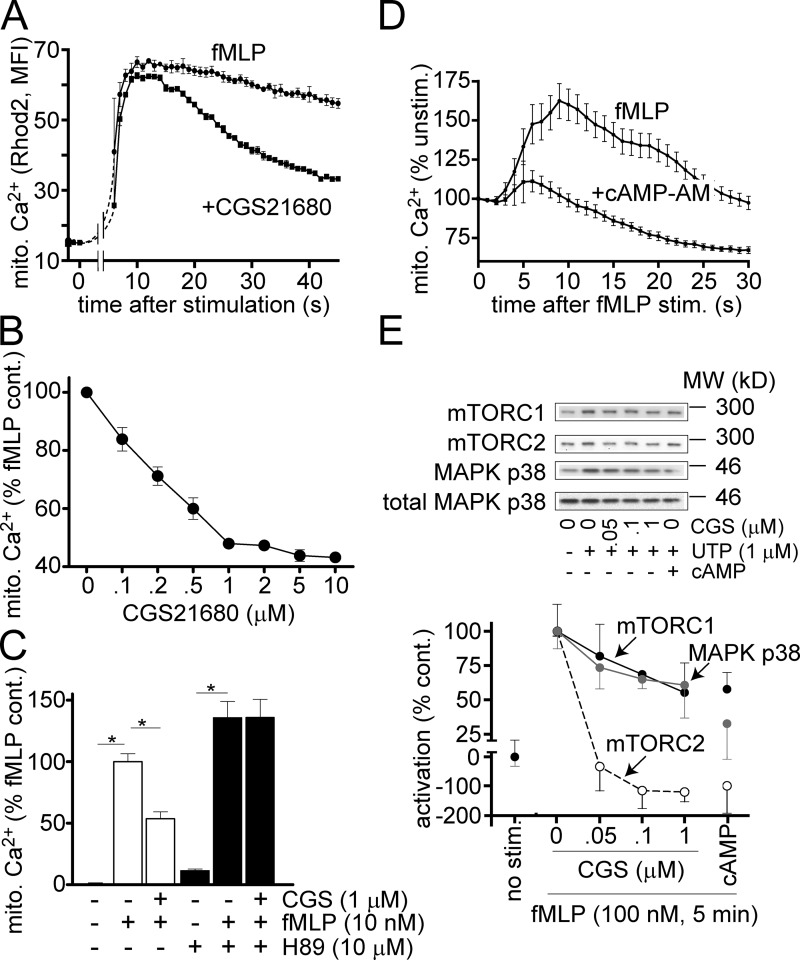
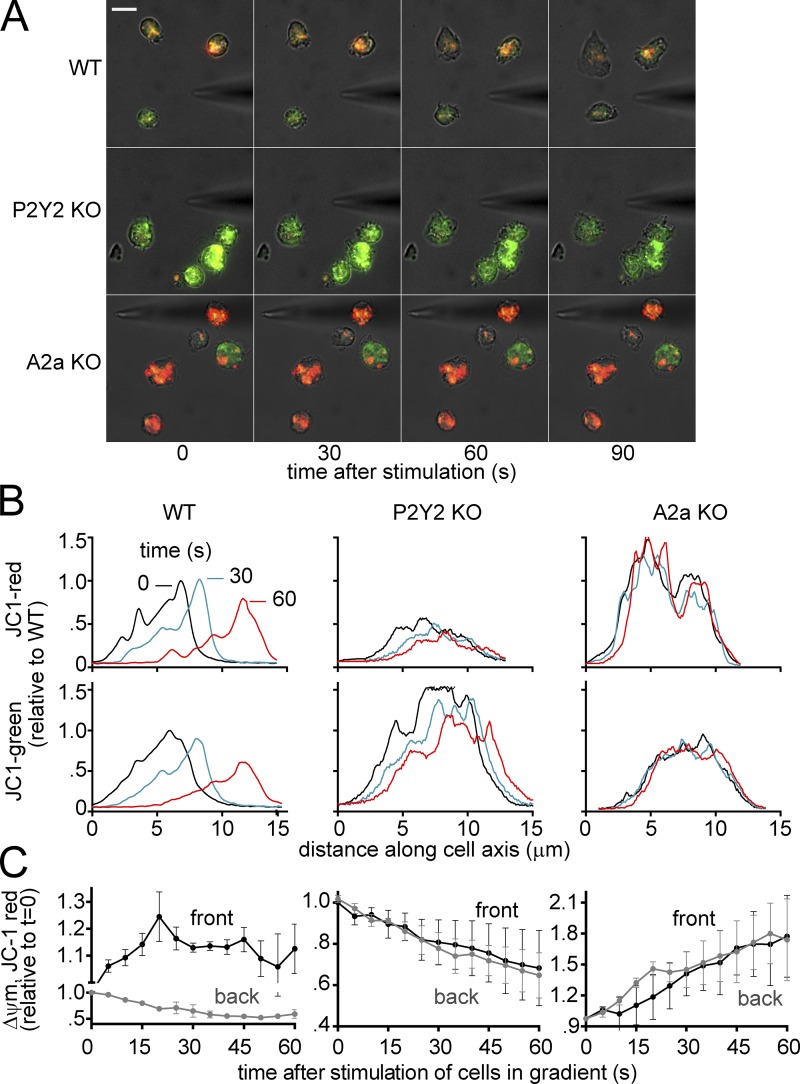
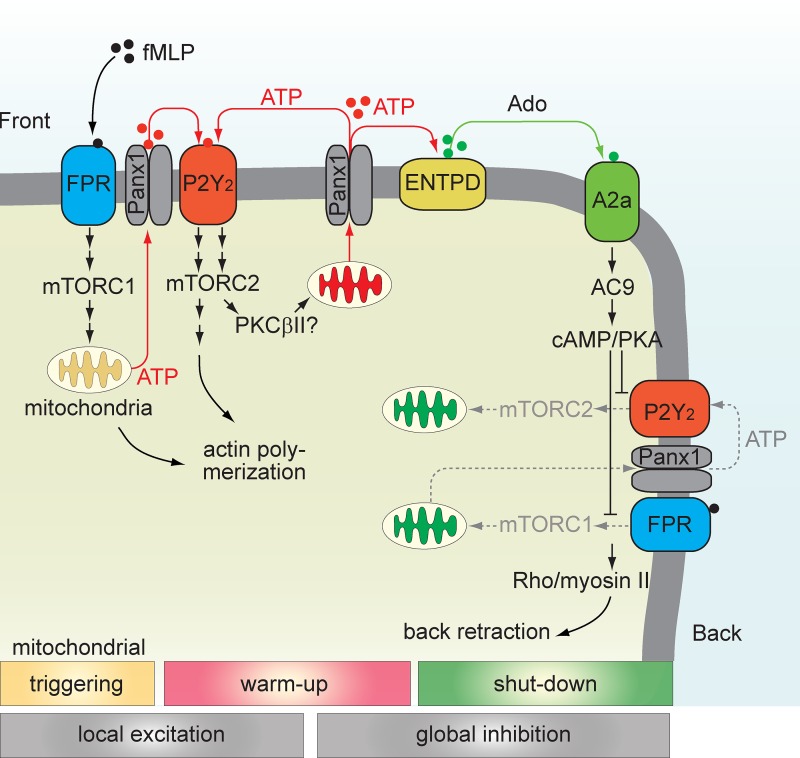
Neutrophils use chemotaxis to locate invading bacteria. Adenosine triphosphate (ATP) release and autocrine purinergic signaling via P2Y2 receptors at the front and A2a receptors at the back of cells regulate chemotaxis. Here, we examined the intracellular mechanisms that control these opposing signaling mechanisms. We found that mitochondria deliver ATP that stimulates P2Y2 receptors in response to chemotactic cues, and that P2Y2 receptors promote mTOR signaling, which augments mitochondrial activity near the front of cells. Blocking mTOR signaling with rapamycin or PP242 or mitochondrial ATP production (e.g., with CCCP) reduced mitochondrial Ca(2+) uptake and membrane potential, and impaired cellular ATP release and neutrophil chemotaxis. Autocrine stimulation of A2a receptors causes cyclic adenosine monophosphate accumulation at the back of cells, which inhibits mTOR signaling and mitochondrial activity, resulting in uropod retraction. We conclude that mitochondrial, purinergic, and mTOR signaling regulates neutrophil chemotaxis and may be a pharmacological target in inflammatory diseases.


Figures

Figure 1.
Figure 1.
Inhibition of mitochondria by CCCP impairs PMN chemotaxis. (A) Freshly isolated primary human PMNs were exposed to a chemotactic gradient using a micropipette loaded with 100 nM fMLP, and migration of cells was recorded under the microscope. The chemotactic behavior of untreated cells and of cells pretreated with 1 µM CCCP with or without 100 µM ATPγS was compared using traces of individual cells (see also Video 1, top). Data shown are representative of results obtained with cells from at least three different healthy individuals. (B) The total length each cell traveled over the observation period was used to calculate migration speed. The effective migration speed was calculated from the Euclidean distance each cell traveled. Cells were considered to migrate in the correct direction when their migration paths did not deviate by more than 60° from a straight line toward the micropipette tip. Cells were isolated from at least three different healthy individuals, and data are expressed as mean ± SD (error bars) of n = 20–40 cells from each donor. Statistical analysis was done with one-way ANOVA; *, P < 0.05.
Figure 2.
Figure 2.
FPR stimulation activates mitochondria at the front of cells. PMNs were plated onto fibronectin-coated glass coverslips and stained with 1 µM Rhod2 for 5 min, and mitochondrial Ca2+ uptake was monitored in real-time using fluorescence microscopy (DMI6000 B; Leica; objective: 100× oil, NA 1.30; DFC365 FX camera; Leica). (A) Rhod2 fluorescence changes after stimulation with 100 nM fMLP using a micropipette (tip indicated by asterisk) were recorded over time and analyzed using ImageJ (inset). The data shown are from a single representative experiment out of at least 15 separate experiments with cells from three donors (bar, 5 µm). (B and C) Rhod2 signal changes at the front and back of the cells were analyzed over time using the sections as shown in A. The distribution of activated mitochondria to the front over time (C) is shown as the percentage of Rhod2 signal at the front versus the whole cell. Data represent means ± SD (error bars) of 15–25 cells (see also Video 3). Statistical analysis was done with one-way ANOVA; *, P < 0.05.
Figure 3.
Figure 3.
Activated mitochondria with higher Δψm accumulate at the front of cells. (A) PMNs were plated onto fibronectin-coated glass coverslips and stained with 100 ng/ml JC-1 for 15 min, and the Δψm was recorded in real time using fluorescence microscopy (DMI6000 B; Leica; objective: 100× oil, NA 1.30; Spot Boost EMCCD camera, EM 150; bar, 5 µm; see also Video 4). (B) The change in JC-1 red fluorescence was analyzed separately for mitochondria at the front and back of cells. (C) The change in the percentage of mitochondria with high versus low membrane potential at the front of cells is shown at different times after fMLP stimulation. Data represent means ± SD (error bars) of normalized gray values of 15–25 cells. Statistical analysis was done with one-way ANOVA; *, P < 0.05.
Figure 4.
Figure 4.
Inhibition of mTOR impairs FPR-induced PMN chemotaxis and blocks mitochondrial activity. (A and B) Freshly isolated primary human PMNs were exposed to a chemotactic gradient using 100 nM fMLP in a micropipette, and cell migration was monitored. The chemotactic behavior of untreated cells and of cells pretreated for 30 min with 1 µM rapamycin or 1 µM PP242 was recorded (see also Video 5, top). Data shown are representative of results obtained with cells from at least three different healthy individuals. (B) Migration speed, effective migration speed, and correct direction were calculated as described for Fig. 1. Data shown are expressed as mean ± SD, and accumulated results are from using cells from at least three different individuals; n = 20–40 cells in each experiment. Statistical analysis was done with one-way ANOVA; *, P < 0.05. (C and D) Mitochondrial Ca2+ uptake in PMNs was assessed with 1 µM Rhod2 as described in Fig. 2 by using a fluorescence microscope (DMI6000 B; Leica; objective: 100× oil, NA 1.30; DFC365 FX camera; Leica). Cells were stimulated with 1 nM fMLP in the absence or presence of 1 µM rapamycin or 1 µM PP242. Data shown are means ± SD (error bars) of normalized gray values of 15–25 cells (bar, 10 µm; see also Video 6).
Figure 5.
Figure 5.
FPR and P2Y2 trigger mTOR phosphorylation and mitochondrial activation. (A) Differentiated HL-60 cells were stimulated for 30 s with 1 µM fMLP, 100 µM ATP, or 100 µM UTP, and mTOR and MAPK p38 activation was determined by immunoblotting with phosphospecific anti-mTOR and anti–MAPK p38 antibodies. Antibodies recognizing total MAPK p38 were used to verify equal protein loading. (B) Freshly isolated PMNs were loaded with 1 µM Rhod2 for 5 min, pretreated or not (control) with 100 µM suramin, and stimulated with fMLP, ATP, or UTP for 1 min, and mitochondrial Ca2+ uptake was estimated with flow cytometry. Results are expressed as means ± SD (error bars) and are representative of at least three independent experiments; one-way ANOVA; *, P < 0.05.
Figure 6.
Figure 6.
P2Y2 receptors trigger mTORC2 signaling. Differentiated HL-60 cells were pretreated with or without 100 µM suramin (A) for 5 min and stimulated with (B) 100 nM fMLP or 10 µM UTP for the indicated periods of time, and activation of MAPK p38, mTORC1, and mTORC2 signaling was determined by immunoblotting as described in Fig. 5. Total MAPK p38 antibodies were used as a protein loading control. Error bars represent means ± SD (error bars) of at least three independent experiments; *, P < 0.05, compared with corresponding control; Student’s t test.
Figure 7.
Figure 7.
A2a receptors block mTORC2 and mitochondrial activation. (A and B) Freshly isolated PMNs were loaded with Rhod2 as described in Fig. 2 and stimulated simultaneously with 10 nM fMLP and 1 µM of the A2a receptor agonist CGS21680 at t = 0 s, and mitochondrial Ca2+ uptake was assessed by flow cytometry. (B) Mitochondrial Ca2+ uptake in cells treated with the indicated concentrations of CGS21680. (C) PMNs loaded with Rhod2 were incubated with or without 10 µM H89 for 30 min and stimulated with 10 nM fMLP ± 1 µM CGS21680, and mitochondrial Ca2+ uptake was assessed with flow cytometry. (D) PMNs loaded with Rhod2 were incubated for 30 min with or without 1 µM cAMP-AM, and mitochondrial Ca2+ uptake in response to fMLP stimulation (1 nM) was monitored with fluorescence microscopy (see also Video 9). (E) Differentiated HL-60 cells were pretreated with 1 µM cAMP-AM and stimulated with 100 nM fMLP, or exposed to the indicated concentrations of CGS21680 and simultaneously stimulated with 100 nM fMLP. After 5 min, mTOR and MAPK p38 activation was determined with immunoblotting as described in Fig. 5. Results are expressed as means ± SD (error bars) of at least three independent experiments; *, P < 0.05; Student’s t test.
Figure 8.
Figure 8.
Impaired neutrophil chemotaxis in P2Y2 or A2a KO mice is caused by disturbed mitochondrial distribution. Mice were injected intraperitoneally with 1 ml zymosan A solution (1 mg/ml in PBS) and sacrificed 12–15 h later. Peritoneal lavage fluid was collected in HBSS plus 0.1% BSA and cultured in fibronectin-coated dishes. (A) Cells were loaded with 200 ng/ml JC-1 for 20 min, washed with HBSS, and exposed to a chemotactic gradient using a micropipette loaded with 1 µM w-peptide (WKYMVM), and Δψm was recorded in real time by using a fluorescence microscope (DMI6000 B; Leica; objective: 100× oil, NA 1.30; DFC365 FX camera; Leica; bar, 10 µm; see also Video 10). (B and C) The distribution of JC-1 red or green signal (B) or change in JC-1 red signal at the front or back of cells over time (C) was analyzed by ImageJ software. Results are representative for experiments done with three to four mice/group (data shown are means ± SD [error bars]).
Figure 9.
Figure 9.
Regulation of chemotaxis by mitochondria, mTOR, and purinergic signaling. Phase 1, trigger: FPR stimulation induces mTORC1 signaling and mitochondrial activation and ATP formation. Phase 2, warm up: ATP release through panx1 triggers P2Y2 receptors that stimulate mTORC2 and enhance mitochondrial activity and ATP production. This promotes actin polymerization and pseudopod protrusion at the front of cells. Phase 3, shut-down: ATP is hydrolyzed to adenosine by ectonucleotidases (ENTPD) on the cell surface, resulting in the stimulation of A2a adenosine receptors at the back of cells. This results in cAMP accumulation and the inhibition of FPR/P2Y2-mediated mTORC signaling and mitochondrial activation, leading to uropod retraction at the back. We propose a purinergic LEGI model, with phases 1 and 2 representing local excitation and phase 3 representing global inhibition.

References

    1. Asfar P., Calzia E., Huber-Lang M., Ignatius A., and Radermacher P.. 2012. Hyperoxia during septic shock—Dr. Jekyll or Mr. Hyde? Shock. 37:122–123. 10.1097/SHK.0b013e318238c991 - DOI - PubMed
    1. Bao Y., Chen Y., Ledderose C., Li L., and Junger W.G.. 2013. Pannexin 1 channels link chemoattractant receptor signaling to local excitation and global inhibition responses at the front and back of polarized neutrophils. J. Biol. Chem. 288:22650–22657. 10.1074/jbc.M113.476283 - DOI - PMC - PubMed
    1. Bao Y., Ledderose C., Seier T., Graf A.F., Brix B., Chong E., and Junger W.G.. 2014. Mitochondria regulate neutrophil activation by generating ATP for autocrine purinergic signaling. J. Biol. Chem. 289:26794–26803. 10.1074/jbc.M114.572495 - DOI - PMC - PubMed
    1. Brookes P.S., Yoon Y., Robotham J.L., Anders M.W., and Sheu S.S.. 2004. Calcium, ATP, and ROS: a mitochondrial love-hate triangle. Am. J. Physiol. Cell Physiol. 287:C817–C833. 10.1152/ajpcell.00139.2004 - DOI - PubMed
    1. Burnstock G. 2007. Purine and pyrimidine receptors. Cell. Mol. Life Sci. 64:1471–1483. 10.1007/s00018-007-6497-0 - DOI - PMC - PubMed

Publication types

MeSH terms