. 2015 Oct 13;112(41):12705-10.
doi: 10.1073/pnas.1508073112. Epub 2015 Sep 28.

Contractility of single cardiomyocytes differentiated from pluripotent stem cells depends on physiological shape and substrate stiffness

Affiliations

Contractility of single cardiomyocytes differentiated from pluripotent stem cells depends on physiological shape and substrate stiffness

Alexandre J S Ribeiro et al. Proc Natl Acad Sci U S A. .

Abstract

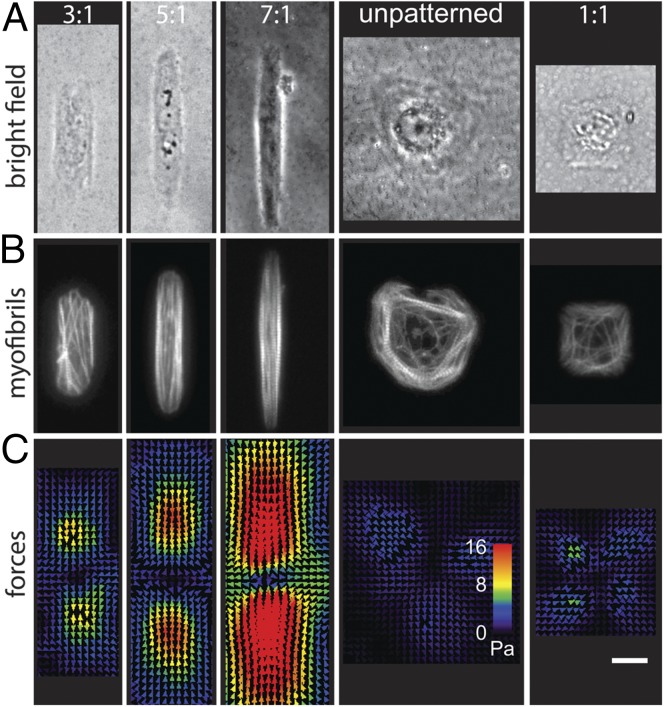
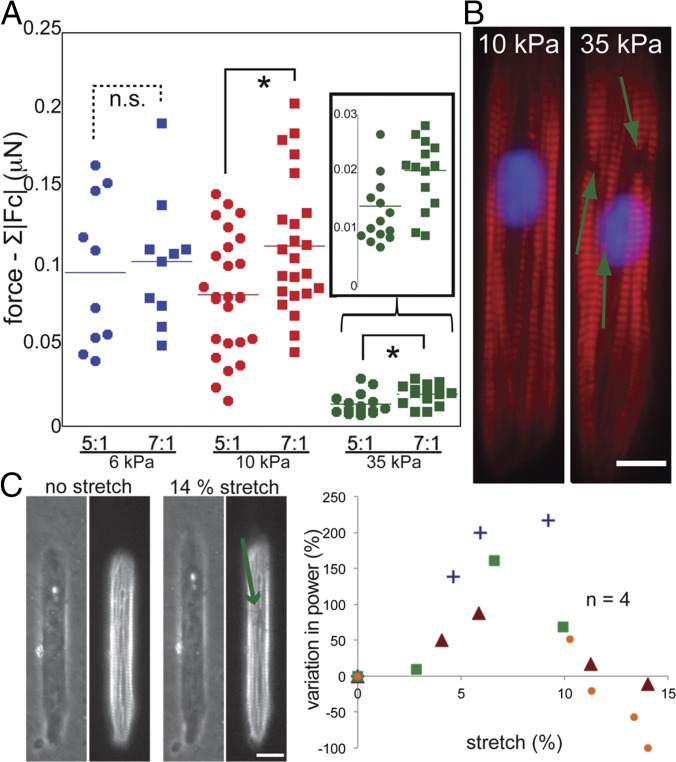
Single cardiomyocytes contain myofibrils that harbor the sarcomere-based contractile machinery of the myocardium. Cardiomyocytes differentiated from human pluripotent stem cells (hPSC-CMs) have potential as an in vitro model of heart activity. However, their fetal-like misalignment of myofibrils limits their usefulness for modeling contractile activity. We analyzed the effects of cell shape and substrate stiffness on the shortening and movement of labeled sarcomeres and the translation of sarcomere activity to mechanical output (contractility) in live engineered hPSC-CMs. Single hPSC-CMs were cultured on polyacrylamide substrates of physiological stiffness (10 kPa), and Matrigel micropatterns were used to generate physiological shapes (2,000-µm(2) rectangles with length:width aspect ratios of 5:1-7:1) and a mature alignment of myofibrils. Translation of sarcomere shortening to mechanical output was highest in 7:1 hPSC-CMs. Increased substrate stiffness and applied overstretch induced myofibril defects in 7:1 hPSC-CMs and decreased mechanical output. Inhibitors of nonmuscle myosin activity repressed the assembly of myofibrils, showing that subcellular tension drives the improved contractile activity in these engineered hPSC-CMs. Other factors associated with improved contractility were axially directed calcium flow, systematic mitochondrial distribution, more mature electrophysiology, and evidence of transverse-tubule formation. These findings support the potential of these engineered hPSC-CMs as powerful models for studying myocardial contractility at the cellular level.

Keywords: cardiomyocyte; contractility; sarcomeres; single cell; stem cell.


Conflict of interest statement

The authors declare no conflict of interest.

Figures

Fig. 1.
Fig. 1.
Matrigel micropatterns on traction-sensitive polyacrylamide hydrogel devices constrain hPSC-CMs to controllable shapes and engineer their mechanical output. Each row of images shows the same cell. Dimensions are similar for all images. Cells were cultured on micropatterns to induce aspect ratios of 1:1–7:1 and areas of 2,000 μm2. (A) Cells imaged with bright-field microscopy. (B) Lifeact-labeled actin in myofibrils in live hPSC-CMs. (C) Heat maps of maximal substrate traction during cell contraction are estimated with traction force microscopy. (Scale bar, 20 μm.)
Fig. 2.
Fig. 2.
Myofibril alignment leads to higher contractile forces in single hPSC-CMs. (A) Σ|Fc| of engineered hPSC-CMs increases with cell aspect ratio. (B) Sarcomere length during contraction and relaxation calculated in Lifeact-labeled cells from intensity profile of line scans (dotted line with green arrow) along myofibrils. (Scale bar, 20 μm.) (C) Sarcomere shortening leads to higher Σ|Fc| in 7:1 cells than in cells with other aspect ratios. (D) The ratio of myofibril movement along the major axis of the cell (u) to myofibril movement along the minor axis of the cell (v) increases as aspect ratio increases. (E) Alignment index of hPSC-CMs with different aspect ratios. Alignment of myofibrils increases with the aspect ratio of hPSC-CMs. ANOVA P value < 0.001 (A, D, and E). *P < 0.01 by unpaired Wilcoxon–Mann–Whitney rank-sum test and by Bonferroni’s all pairs comparison test; n.s., not significant. Each point indicates one cell. In A, D, and E, lines denote the mean.
Fig. 3.
Fig. 3.
Substrate stiffness and substrate stretching affect the myofibril integrity and mechanical output of engineered hPSC-CMs. (A) hPSC-CMs (7:1) produced higher Σ|Fc| than 5:1 cells on 10- and 35-kPa substrates. *P < 0.01 by unpaired Wilcoxon–Mann–Whitney rank-sum test; n > 9. Each dot indicates one cell. Lines indicate the mean. (B) Myofibrils (green arrows) were disrupted in Lifeact-labeled (red) hPSC-CMs cultured on 35-kPa substrates. Blue = nucleus. (Scale bar, 10 μm.) (C) (Left) Single Lifeact-labeled 7:1 cell under stretch. Myofibrils were disrupted (green arrow), and mechanical force was reduced, at a stretch of 14% of the cell’s unstretched length. (Scale bar, 20 μm.) (Right) Power generated by single cells increased and then decreased over this range of stretch. n, number of stretched cells analyzed. Each symbol is a single cell.
Fig. 4.
Fig. 4.
hPSC-CMs on 7:1 patterns have phenotypes similar to those of mature CMs. (A) Labeled calcium (green) flowed along the major axis of 7:1 cells but flowed isotropically in unpatterned cells. Intensity (I) plotted with arbitrary units (a.u.). (Scale bars, 20 μm.) (B) Mitochondria were labeled (green) in cells expressing Lifeact (red). The distribution of mitochondria in 7:1 hPSC-CMs differed from that in unpatterned cells. [Scale bars, 20 μm (Top) and 50 μm (Bottom).] Blue, nuclei. (C) (Left) Patch-clamp recordings of variations in membrane action potential over time during single-cell contractions. (Right) Action potential amplitude, resting membrane potential, and maximum upstroke velocity of seven unpatterned cells and seven 7:1 cells. Means and SDs are shown. (D) Single-cell gene expression assayed by qRT-PCR. Centerlines indicate medians; box limits indicate 25th and 75th percentiles; whiskers encompass 1.5 times the interquartile range. (E) Cells labeled with di-8-ANEPPS (see SI Appendix, SI Materials and Methods). (Left) hPSC-CM (7:1). (Scale bar, 25 μm.) (Center) Unpatterned hPSC-CM on a 10-kPa hydrogel shown in both Top and Bottom. (Scale bars, 50 μm.) (Right) Isolated adult mouse ventricular CM. (Scale bar, 25 μm.)

References

    1. Dorn GW, II, Molkentin JD. Manipulating cardiac contractility in heart failure: Data from mice and men. Circulation. 2004;109(2):150–158. - PubMed
    1. Louch WE, Sheehan KA, Wolska BM. Methods in cardiomyocyte isolation, culture, and gene transfer. J Mol Cell Cardiol. 2011;51(3):288–298. - PMC - PubMed
    1. de Tombe PP, ter Keurs HE. The velocity of cardiac sarcomere shortening: Mechanisms and implications. J Muscle Res Cell Motil. 2012;33(6):431–437. - PMC - PubMed
    1. Lodish HF, et al. Molecular Cell Biology. 7th Ed. W. H. Freeman; New York: 2012. Myosin-powered movements; pp. 801–805.
    1. Knöll R, Buyandelger B, Lab M. The sarcomeric Z-disc and Z-discopathies. J Biomed Biotechnol. 2011;2011:569628. - PMC - PubMed

Publication types