

Global biogeography of human infectious diseases
- PMID: 26417098
- PMCID: PMC4611664
- DOI: 10.1073/pnas.1507442112
Global biogeography of human infectious diseases
Abstract
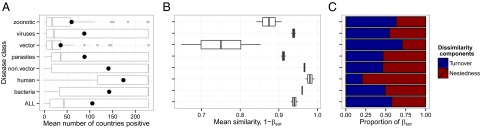
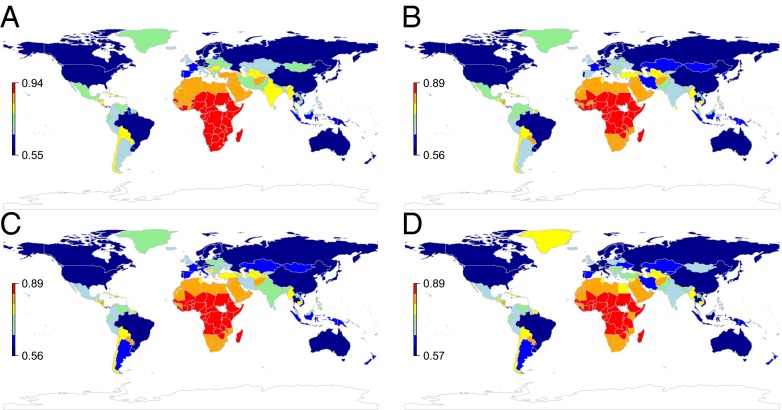
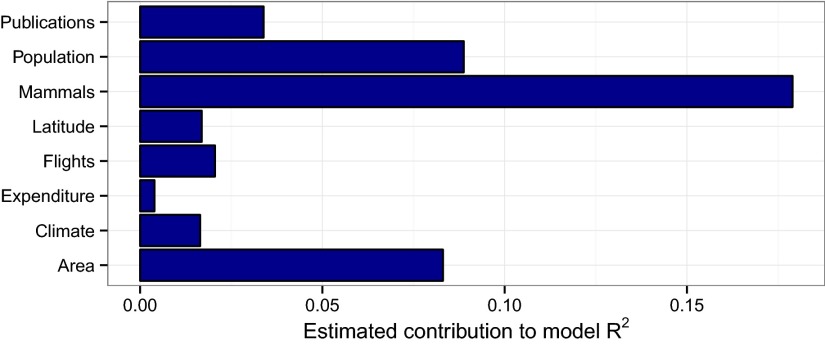
The distributions of most infectious agents causing disease in humans are poorly resolved or unknown. However, poorly known and unknown agents contribute to the global burden of disease and will underlie many future disease risks. Existing patterns of infectious disease co-occurrence could thus play a critical role in resolving or anticipating current and future disease threats. We analyzed the global occurrence patterns of 187 human infectious diseases across 225 countries and seven epidemiological classes (human-specific, zoonotic, vector-borne, non-vector-borne, bacterial, viral, and parasitic) to show that human infectious diseases exhibit distinct spatial grouping patterns at a global scale. We demonstrate, using outbreaks of Ebola virus as a test case, that this spatial structuring provides an untapped source of prior information that could be used to tighten the focus of a range of health-related research and management activities at early stages or in data-poor settings, including disease surveillance, outbreak responses, or optimizing pathogen discovery. In examining the correlates of these spatial patterns, among a range of geographic, epidemiological, environmental, and social factors, mammalian biodiversity was the strongest predictor of infectious disease co-occurrence overall and for six of the seven disease classes examined, giving rise to a striking congruence between global pathogeographic and "Wallacean" zoogeographic patterns. This clear biogeographic signal suggests that infectious disease assemblages remain fundamentally constrained in their distributions by ecological barriers to dispersal or establishment, despite the homogenizing forces of globalization. Pathogeography thus provides an overarching context in which other factors promoting infectious disease emergence and spread are set.
Keywords: biogeography; distribution; globalization; infectious disease; pathogeography.
Conflict of interest statement
The authors declare no conflict of interest.
Figures
Comment in
-
Additive partitioning of a beta diversity index is controversial.Proc Natl Acad Sci U S A. 2015 Dec 29;112(52):E7161. doi: 10.1073/pnas.1521798113. Epub 2015 Dec 18. Proc Natl Acad Sci U S A. 2015. PMID: 26684769 Free PMC article. No abstract available.
-
Reply to Chen and Schmera: Partitioning beta diversity into replacement and nestedness-resultant components is not controversial.Proc Natl Acad Sci U S A. 2015 Dec 29;112(52):E7162. doi: 10.1073/pnas.1522279113. Epub 2015 Dec 18. Proc Natl Acad Sci U S A. 2015. PMID: 26684771 Free PMC article. No abstract available.
References
Publication types
MeSH terms
LinkOut - more resources
Full Text Sources
Other Literature Sources
Medical
