. 2015 Oct 13;112(41):12776-81.
doi: 10.1073/pnas.1512995112. Epub 2015 Sep 28.

New roles for DNA cytosine modification, eRNA, anchors, and superanchors in developing B cell progenitors

Affiliations

New roles for DNA cytosine modification, eRNA, anchors, and superanchors in developing B cell progenitors

Christopher Benner et al. Proc Natl Acad Sci U S A. .

Abstract

B-cell fate is orchestrated by a series of well-characterized developmental regulators. Here, we found that the onset of B-cell development was accompanied by large-scale changes in DNA cytosine modifications associated with promoters, enhancers, and anchors. These changes were tightly linked to alterations in transcription factor occupancy and nascent RNA (eRNA) transcription. We found that the prepro-B to the pro-B-cell transition was associated with a global exchange of DNA cytosine modifications for polycomb-mediated repression at CpG islands. Hypomethylated regions were found exclusively in the active/permissive compartment of the nucleus and were predominantly associated with regulatory elements or anchors that orchestrate the folding patterns of the genome. We identified superanchors, characterized by clusters of hypomethylated CCCTC-binding factor (CTCF)-bound elements, which were predominantly located at boundaries that define topological associated domains. A particularly prominent hypomethylated superanchor was positioned down-stream of the Ig heavy chain (Igh) locus. Analysis of global formaldehyde-cross-linking studies indicated that the Igh locus superanchor interacts with the VH region repertoire across vast genomic distances. We propose that the Igh locus superanchor sequesters the VH and DHJH regions into a spatial confined geometric environment to promote rapid first-passage times. Collectively, these studies demonstrate how, in developing B cells, DNA cytosine modifications associated with regulatory and architectural elements affect patterns of gene expression, folding patterns of the genome, and antigen receptor assembly.

Keywords: DNA modification; immunoglobulin heavy chain locus; nuclear architecture; superanchor; superinsulator.


Conflict of interest statement

The authors declare no conflict of interest.

Figures
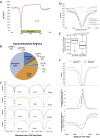
Fig. S1.
Fig. S1.
(A) Metagene analysis of DNA methylation across genic regions. (B) Annotation of hypomethylated regions in the mouse genome. (C) Cistromes for transcriptional regulators associated with a B-lineage–specific transcription signature are closely associated with hypomethylation. (D) Methylation levels at promoters associated with different epigenetic modifications. (E) Distribution of mCpG% measured from −1 kb to + 1 kb at 3,109 intergenic E2A peaks segregated by the presence of eRNA at each loci. eRNA-positive loci were significantly more depleted of methylation near their peaks (P << 10–50, Mann–Whitney rank sum test). (F) CpG methylation, H3K4me3, and H3K36me3 profiles at active unidirectional and bidirectional promoters. Directionality of promoters was determined by strand-specific GRO-Seq reads found upstream and downstream of transcription start sites.
Fig. 1.
Fig. 1.
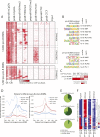
Global patterns of hypomethylation across regulatory elements in the pro–B-cell genome. (A) Unbiased hierarchical clustering of hypomethylated genomic regions with respect to mCpG%, histone modification ChIP-Seq, DNase hypersensitivity, and CTCF ChIP-Seq in pro-B cells. Active promoters were characterized by enrichment for H3K4me3. Enhancer regions were assigned by deposition of H3K4me1/2. Polycomb bodies were identified by the deposition of H3K27me3. (B) Hypomethylated genomic regions associated with the Pax5 locus. Hypomethylated regions were observed across the Pax5 promoter, enhancer, and CTCF binding sites. (C) CpG methylation metaprofile associated with all CTCF-bound sites in pro-B cells revealing nucleosomal fluctuations. (D) Mechanistic link involving eRNA transcription and DNA hypomethylation. Differences in methylation profiles at intergenic E2A peaks associated with transcriptionally active regions (>5 GRO-Seq reads per locus) versus intergenic E2A-bound sites that were not linked with eRNA transcription (<2 GRO-Seq reads per locus). Both sets of binding sites were hypomethylated at the binding sites, but transcriptionally active E2A enhancers displayed broader domains of hypomethylated DNA. The + and – symbols discriminate between nascent RNA transcription originating from the + and – strand. (E) CpG methylation profile at active unidirectional and bidirectional promoters. Directionality of promoters was determined by strand-specific GRO-Seq reads found upstream and downstream of the transcription start site (Fig. S1E).
Fig. S2.
Fig. S2.
(A) Metagene analysis or pro-B and prepro-B DNA methylation levels across gene bodies. (B and C) DNA methylation profiles across key B lineage genes. (D and E) DNA cytosine modifications and H3K4me2 levels in prepro-B and pro-B cells across sites that are associated with E2A occupancy in pro-B cells. (F and G) Forced E47 expression in E2A-deficient prepro-B cells results in 40,000 E47 bound sites of which 50% are hypermethylated (>50% mCpG) in prepro-B cells. H3K4me1 levels of E47 sites that bind hypermethylated and hypomethylated regions in prepro-B cells are shown. (H) Gene ontology functional enrichment results of genes associated with constitutively methylated CpG islands found in group IV (Fig. S3F).
Fig. S3.
Fig. S3.
Differential methylation across regulatory genomic regions during the prepro-B to pro–B-cell transition. (A) DMRs associated with either the prepro-B or pro–B-cell genomes were identified and clustered by using mCpG%, H3K4me2, H3K27me3, and CTCF ChIP-Seq read densities. More than 14,000 pro-B DMRs were identified, which were closely associated with pro-B–specific patterns of H3K4me2 and H3K27me3. In contrast, only 1,299 prepro-B DMRs were identified and found associated with prepro-B specific patterns of H3K4me2. (B) A de novo motif finding to genomic regions was used to identify genomic regions that were differentially methylated. (C) Validation of de novo prediction for cis-regulatory elements associated with differentially methylated regions in prepro-B versus pro-B cells using ChIP-Seq reads for E2A (pro-B cells), EBF (pro-B cells) and PU.1 (prepro-B cells and pro-B cells). (D) Differential eRNA expression (GRO-Seq reads) found at DMRs is specific to each cell type, respectively. (E) CpG island composition of DMRs associated with distinct epigenetic modifications. (F) Demethylated CpG islands are primarily recruited to polycomb bodies. Group I indicates a cluster of active (H3K4me2+) and hypomethylated CpG islands that do not display a change in the degree of DNA methylation in prepro-B versus pro-B cells. Group II reflects a cluster of regulatory elements that become hypomethylated during the prepro-B to pro–B-cell transition and are predominantly recruited to polycomb bodies or become transcriptionally active (H3K4me2+). Group III represents a cluster of regulatory elements that are associated with highly transcribed gene bodies (H3K36me3+) but do not display a change in the degree of DNA cytosine modifications. Group IV represents a cluster of regulatory elements highly enriched for genes associated with meiosis and reproduction and remain hypermethylated during the prepro-B to pro–B-cell transition.
Fig. S4.
Fig. S4.
Hypomethylation is closely associated with anchors that mediate long-range genomic interactions. (A) Hypomethylated regions are predominantly associated with the transcriptionally permissive compartment. Heterochromatic and euchromatic compartmentalization of chromosome 17 derived from murine pro-B cells as defined by PC1 values that were obtained from HiC analysis. Hypomethylated regions and active regions indicated by H3K4me2 enrichment are indicated along chromosome 17. (B) Average DNA methylation levels in 50-kb intervals and PC1 values along chromosome 17 for both prepro-B (blue) and pro-B cells (red). Differences in average methylation profiles are shown in green. (C) Hypomethylated genomic regions are frequently associated with anchor elements. Genomic interactions identified from pro-B Hi-C data involving multiple anchors across the Rnf145 locus are shown. Genomic regions that display distinct patterns of hypomethylation are indicated. (D) Anchors participating in hubs that interact with multiple partners are frequently hypomethylated. (E) Anchors associated with significant genomic interactions across either prepro-B or pro-B genomes are highly enriched for demethylated regions associated with either cell type. (F) Elaborate patterns of looping are closely associated with anchors located in hypomethylated genomic regions. Circos diagrams displaying long-range genomic interactions across the Pax5 and Zcchc7 loci are shown.
Fig. S5.
Fig. S5.
(A) The heterochromatic compartment of prepro-B cells is associated with a lower proportion of mCpGs compared with pro-B cells. The distribution of mCpG% found at individual CpG residues (five reads minimum coverage). (B) The Igk locus, spanning variable, joining, and enhancer gene segments, is associated with highly maintained patterns of hypermethylation in pro-B cells but not prepro-B cells.
Fig. 2.
Fig. 2.
Superanchors are closely associated with hypomethylated CTCF-binding sites at boundaries flanking topological associated domains. (A) Hypomethylated regions are frequently associated with boundary elements that define topological-associated domains. Metaplot of hypomethylated regions and ChIP-Seq peaks density across topological-associated domains. (B) Distribution of CTCF motifs based on matching strand at the 5′ and 3′ edges of topological-associated domains. Primary orientation of CTCF motif at each boundary is displayed above each plot. (C) Super enhancer-style plot used to identify superanchors depicting the ranked signal for CTCF at putative CTCF clusters. Superanchors and typical anchors were identified in the same manner that superenhancers and typical enhancers are identified, the only difference being that superanchors were found by using CTCF occupancy. As a result, typical anchors are associated with single CTCF peaks found in the genome. The cutoff for superanchors was defined where the slope of the graph equals one. Levels of representative superanchors indicated. (D) Superanchor that separates the Malm3 and Foxo1 loci with levels of CTCF, DNA methylation, H3K4me2, and nascent RNA levels indicated. Note the cluster of CTCF bound sites across the putative superinsulator. (E) Distribution of superanchors versus typical anchors and superenhancers versus typical enhancers across topological domains. Levels are normalized to the total number of elements in each category to compare the relative levels for each feature. (F) Distribution of CTCF motifs and their orientation along superanchor elements. (G) Differentially bound superanchor at the Thbd locus with differential CTCF recruitment, DNA methylation, and histone modifications.
Fig. S6.
Fig. S6.
(A) Overlap of prepro-B and pro-B superanchor regions. (B) Comparison of CTCF ChIP-Seq levels at prepro-B and pro-B super anchors. (C) Levels of mCpG%, CTCF, H3K4me2, H3K27me3 ChIP-Seq, and GRO-Seq at the X-linked Firre locus in prepro-B (female) and pro-B (male) experiments. (D) Evidence of demethylation at pro-B–specific CTCF sites. Metaanalysis of mCpG% at CTCF sites specifically bound in pro-B cells.
Fig. 3.
Fig. 3.
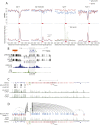
Characterization of the Ig heavy chain (Igh) locus superanchor. (A) Schematic of the Igh locus depicting the locations of predicted CTCF motifs, bound CTCF motifs, DNA methylation, and ChIP-Seq signal across the locus. The normalized Hi-C interaction frequencies are shown above the locus. (B) Zoomed in representation of the Igh superanchor, IGCR1 region, and representative VH and pseudo VH regions. (C) Model depicting looping patterns involving the superanchor and an ensemble of variable regions associated with the Igh locus.
Fig. S7.
Fig. S7.
(A) CTCF bound sites flanking the VH regions are highly enriched for demethylated CpGs in the Igh and Tcra loci, but not Igk and or VH pseudo regions. (B) The JH regions in the Igh locus are demethylated during the prepro-B to pro–B-cell transition. (C) CTCF binding and superanchors near the Igh locus are invariant during the prepro-B to pro-B transition. (D) Schematic diagram of looping involving VH regions and the superanchor.

References

    1. Adolfsson J, et al. Identification of Flt3+ lympho-myeloid stem cells lacking erythro-megakaryocytic potential a revised road map for adult blood lineage commitment. Cell. 2005;121(2):295–306. - PubMed
    1. Inlay MA, et al. Ly6d marks the earliest stage of B-cell specification and identifies the branchpoint between B-cell and T-cell development. Genes Dev. 2009;23(20):2376–2381. - PMC - PubMed
    1. Nutt SL, Kee BL. The transcriptional regulation of B cell lineage commitment. Immunity. 2007;26(6):715–725. - PubMed
    1. Mercer EM, Lin YC, Murre C. Factors and networks that underpin early hematopoiesis. Semin Immunol. 2011;23(5):317–325. - PMC - PubMed
    1. Mercer EM, et al. Multilineage priming of enhancer repertoires precedes commitment to the B and myeloid cell lineages in hematopoietic progenitors. Immunity. 2011;35(3):413–425. - PMC - PubMed

Publication types

Associated data