. 2015 Oct 13;112(41):12610-5.
doi: 10.1073/pnas.1513127112. Epub 2015 Sep 28.

Increased threat of tropical cyclones and coastal flooding to New York City during the anthropogenic era

Affiliations

Increased threat of tropical cyclones and coastal flooding to New York City during the anthropogenic era

Andra J Reed et al. Proc Natl Acad Sci U S A. .

Abstract

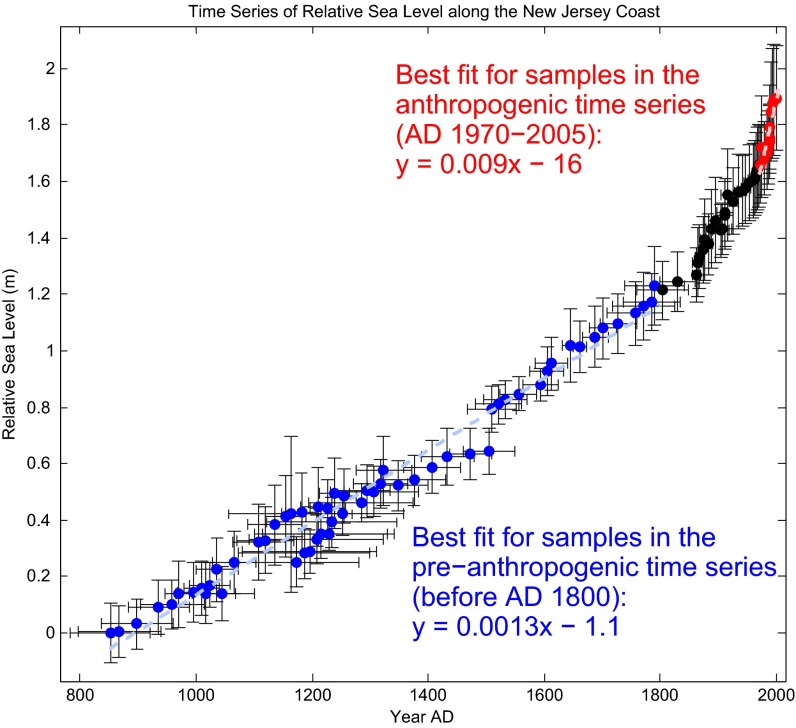
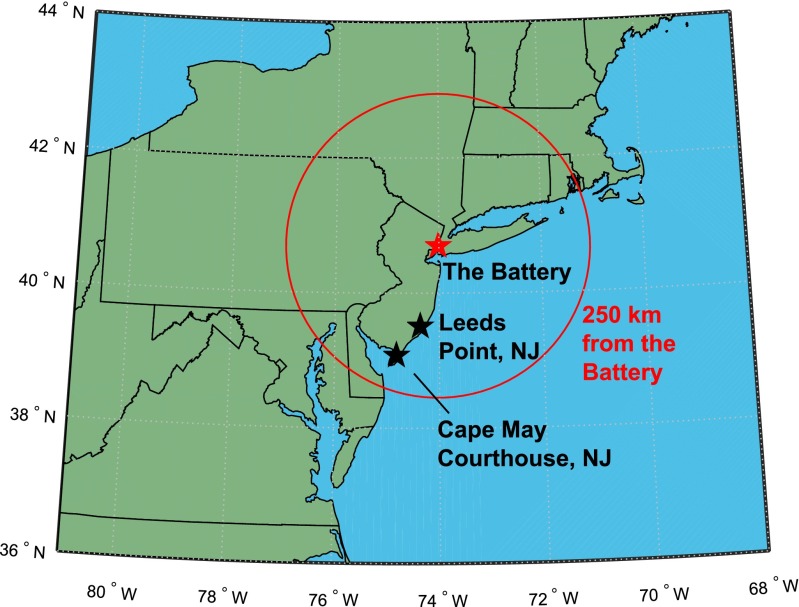
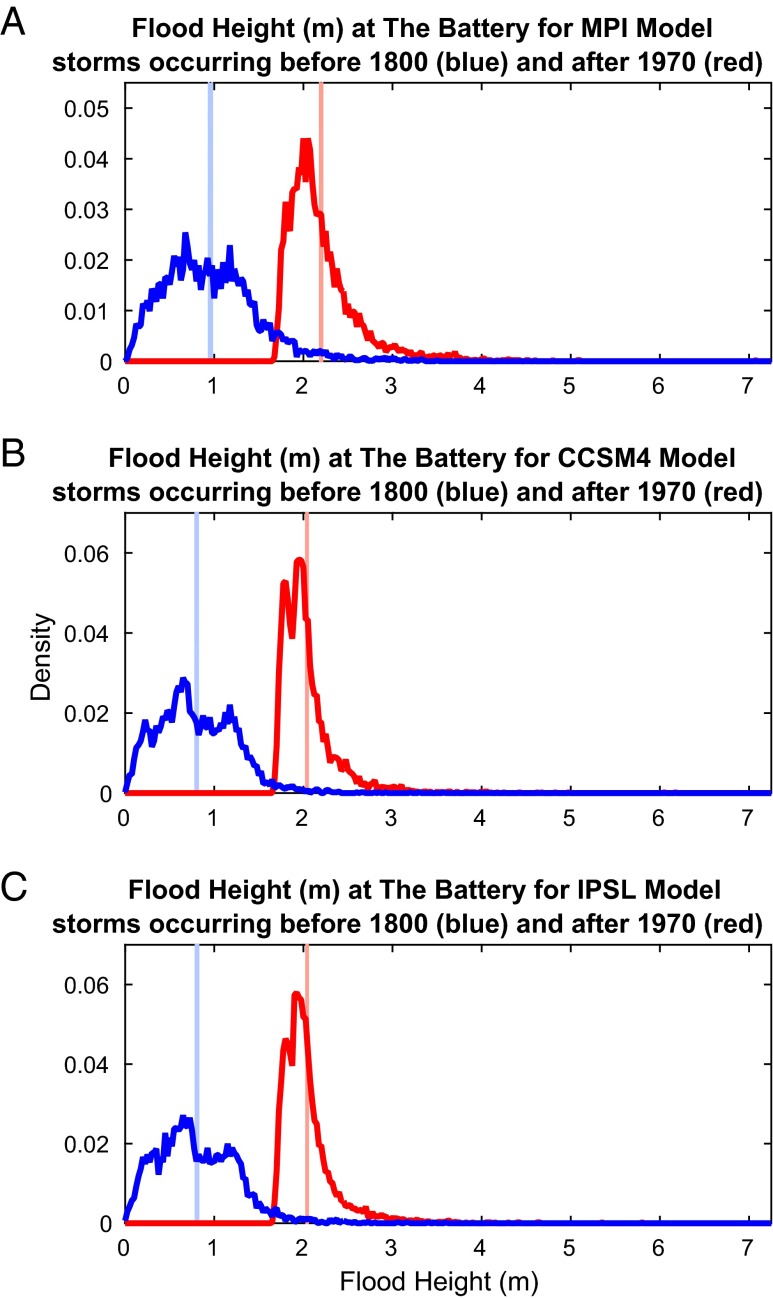
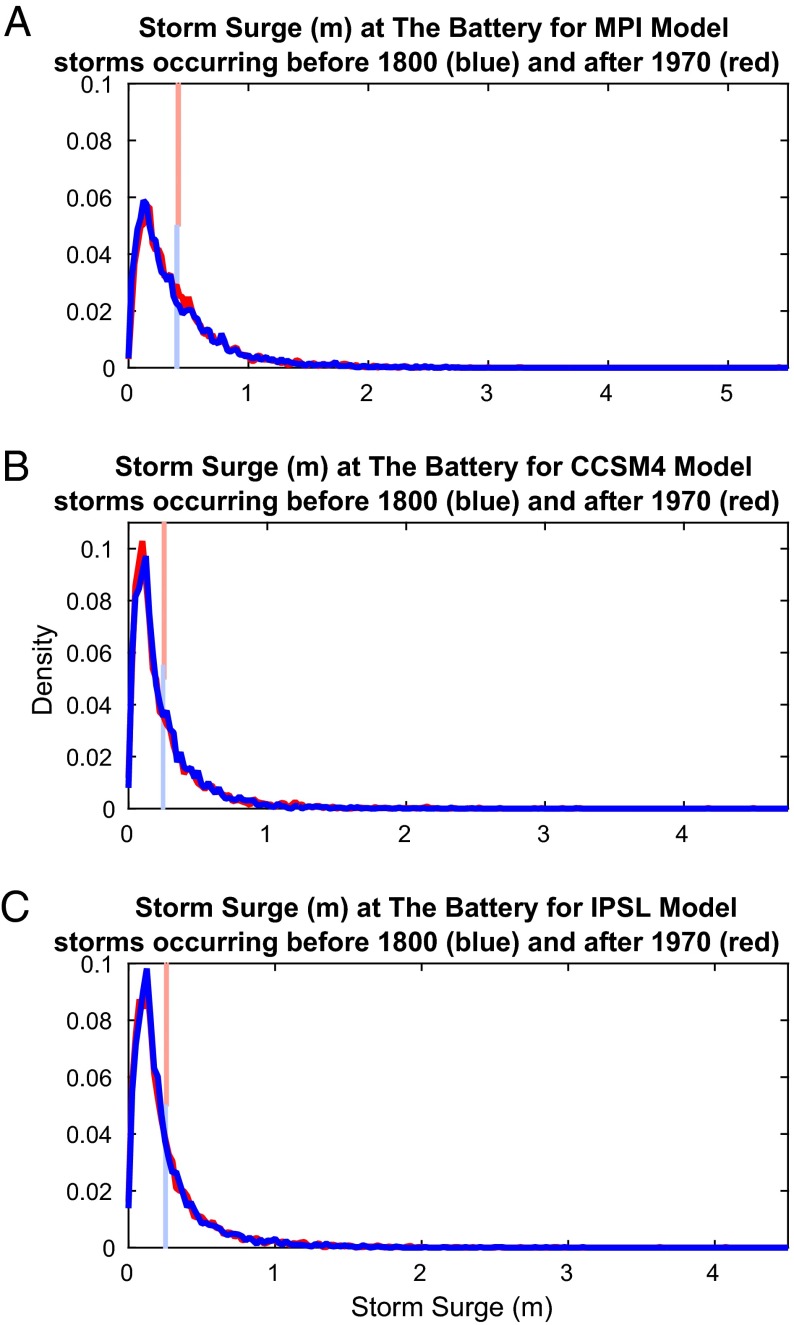
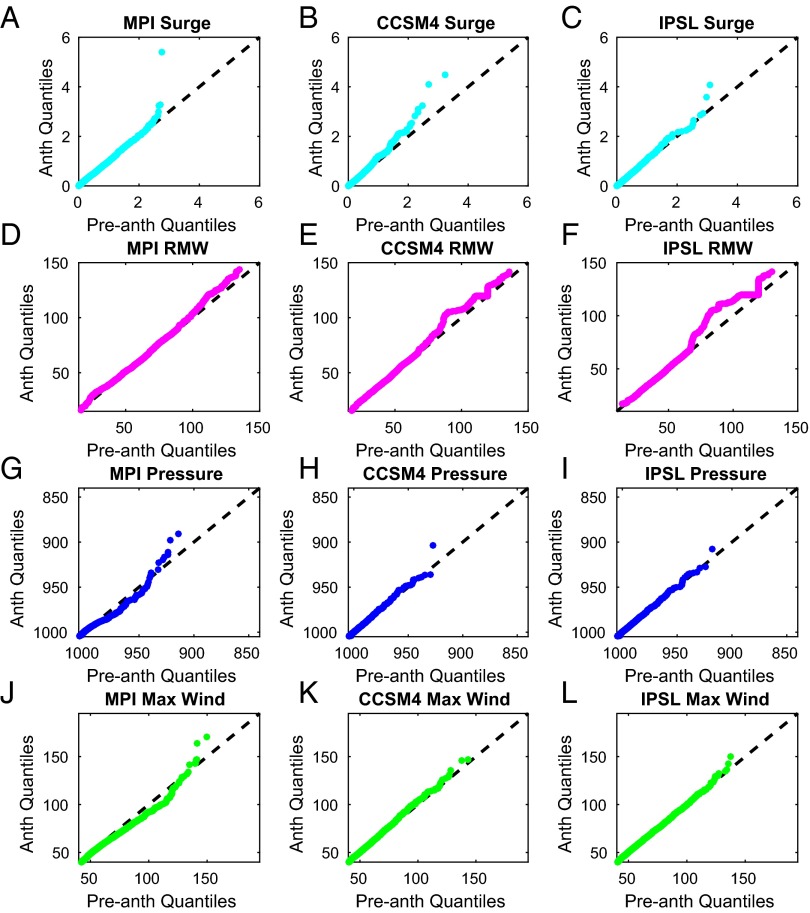
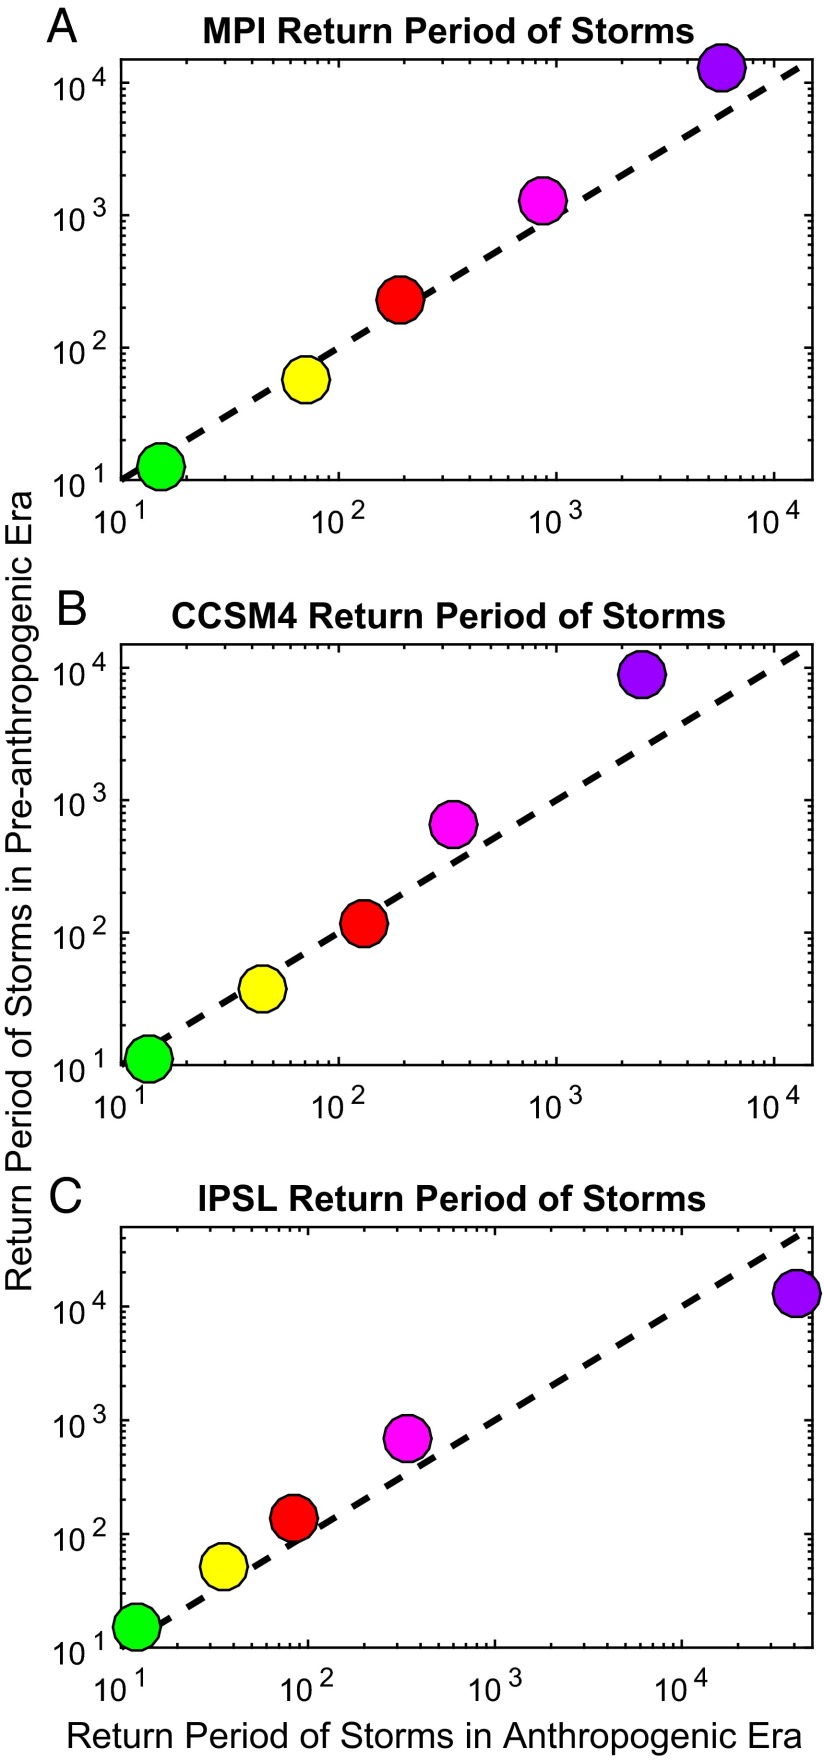
In a changing climate, future inundation of the United States' Atlantic coast will depend on both storm surges during tropical cyclones and the rising relative sea levels on which those surges occur. However, the observational record of tropical cyclones in the North Atlantic basin is too short (A.D. 1851 to present) to accurately assess long-term trends in storm activity. To overcome this limitation, we use proxy sea level records, and downscale three CMIP5 models to generate large synthetic tropical cyclone data sets for the North Atlantic basin; driving climate conditions span from A.D. 850 to A.D. 2005. We compare pre-anthropogenic era (A.D. 850-1800) and anthropogenic era (A.D.1970-2005) storm surge model results for New York City, exposing links between increased rates of sea level rise and storm flood heights. We find that mean flood heights increased by ∼1.24 m (due mainly to sea level rise) from ∼A.D. 850 to the anthropogenic era, a result that is significant at the 99% confidence level. Additionally, changes in tropical cyclone characteristics have led to increases in the extremes of the types of storms that create the largest storm surges for New York City. As a result, flood risk has greatly increased for the region; for example, the 500-y return period for a ∼2.25-m flood height during the pre-anthropogenic era has decreased to ∼24.4 y in the anthropogenic era. Our results indicate the impacts of climate change on coastal inundation, and call for advanced risk management strategies.

Keywords: New Jersey; flood height; relative sea level; storm surge; tropical cyclones.


Conflict of interest statement

The authors declare no conflict of interest.

Figures

Fig. 1.
Fig. 1.
Relative sea level reconstruction compiled for southern New Jersey using reconstructions from two sites [Leeds Point and Cape May Courthouse (6)]. Samples dated from the pre-anthropogenic era are shown in blue. Samples shown in black are from the interim time period between the pre-anthropogenic and anthropogenic time periods. Samples dated from the anthropogenic era are shown in red. A light blue dashed line shows the best fit line for the pre-anthropogenic era data, and a pink dashed line shows the best fit line for the anthropogenic era data. Equations of the best fit lines are given on the figure. Horizontal error bars represent the 2σ uncertainty, in calendar years, of the year associated with each point. Vertical error bars represent the approximate 1σ uncertainty, in meters, of the sea level associated with each point.
Fig. 2.
Fig. 2.
Map showing the New York and New Jersey coastal region. A filter was used to select storms that moved within 250 km of The Battery in NYC and had maximum winds of at least 40 kts. The Battery is labeled and shown by the red star on the map; a 250-km radius around The Battery is shown by the red circle on the map. Proxy sea level records were constructed from samples obtained at Leeds Point, NJ, and Cape May Courthouse, NJ; both of these locations are labeled and shown by black stars on the map.
Fig. 3.
Fig. 3.
Distributions of flood heights for the pre-anthropogenic era (blue) and the anthropogenic era (red) for (A) the MPI model, (B) the CCSM4 model, and (C) the IPSL model. Each distribution is normalized by the number of events it contains. The 99% confidence interval, found by running 100,000 bootstraps of the mean of each set, is shown in light blue for pre-anthropogenic era flood events, and in light red for anthropogenic era flood events.
Fig. 4.
Fig. 4.
Distributions of storm surge heights for the pre-anthropogenic era (blue) and the anthropogenic era (red) for (A) the MPI model, (B) the CCSM4 model, and (C) the IPSL model. Each distribution is normalized by the number of events it contains. The 99% confidence interval, found by running 100,000 bootstraps of the mean of each set, is shown in light blue for pre-anthropogenic era storm surge events, and in light red for anthropogenic era storm surge events.
Fig. 5.
Fig. 5.
Q−Q plots indicating differences between the pre-anthropogenic era and anthropogenic era (AC) storm surge heights, (D−F) RMW for storms, (GI) minimum storm pressure, and (JL) maximum winds for storms. Results are shown for MPI (A, D, G, and J), CCSM4 (B, E, H, and K), and IPSL (C, F, I, and L) models, and variables are considered at landfall. Dashed lines in the plots indicate the line y = x. Points that deviate from this line indicate that the two distributions being compared differ from one another.
Fig. 6.
Fig. 6.
Comparison of the return periods of storms for the NYC region, by category, in the pre-anthropogenic era (A.D. 850–1800) to the return periods of storms, by category, in the anthropogenic era for (A) the MPI model, (B) the CCSM4 model, and (C) the IPSL model. Categories are according to the Saffir−Simpson scale: Category 1(green), winds 64–82 kts, or 74–95 mph; Category 2 (yellow), winds 83–95 kts, or 96–110 mph; Category 3 (red), winds 96–112 kts, or 111–129 mph; Category 4 (magenta), winds 113–136 kts, or 130–156 mph; Category 5 (purple), winds 137 kts or higher, or 157 mph or higher.

References

    1. Emanuel K. Increasing destructiveness of tropical cyclones over the past 30 years. Nature. 2005;436(7051):686–688. - PubMed
    1. Pielke RA., Jr Future economic damage from tropical cyclones: sensitivities to societal and climate changes. Philos Trans R Soc A. 2007;365(1860):2717–2729. - PubMed
    1. Rappaport EN. Fatalities in the United States from Atlantic tropical cyclones: New data and interpretation. Bull Am Meteorol Soc. 2014;95(3):341–346.
    1. Blake ES, Kimberlain TB, Berg RJ, Cangialosi JP, Beven JL., II . Tropical Cyclone Report: Hurricane Sandy (AL182012), 22−29 October 2012. Natl Hurricane Cent; Miami: 2013.
    1. Tebaldi C, Strauss BH, Zervas C. Modelling sea level rise impacts on storm surges along US coasts. Environ Res Lett. 2012;7(1):021001.

Publication types