

Comment
doi: 10.1073/pnas.1502868112.
Epub 2015 Sep 28.
Implications of simplified linkage equilibrium SNP simulation
Affiliations
- PMID: 26417113
- PMCID: PMC4603486
- DOI: 10.1073/pnas.1502868112
Item in Clipboard
Comment
Implications of simplified linkage equilibrium SNP simulation
Proc Natl Acad Sci U S A.
.
No abstract available
Conflict of interest statement
The author declares no conflict of interest.
Figures
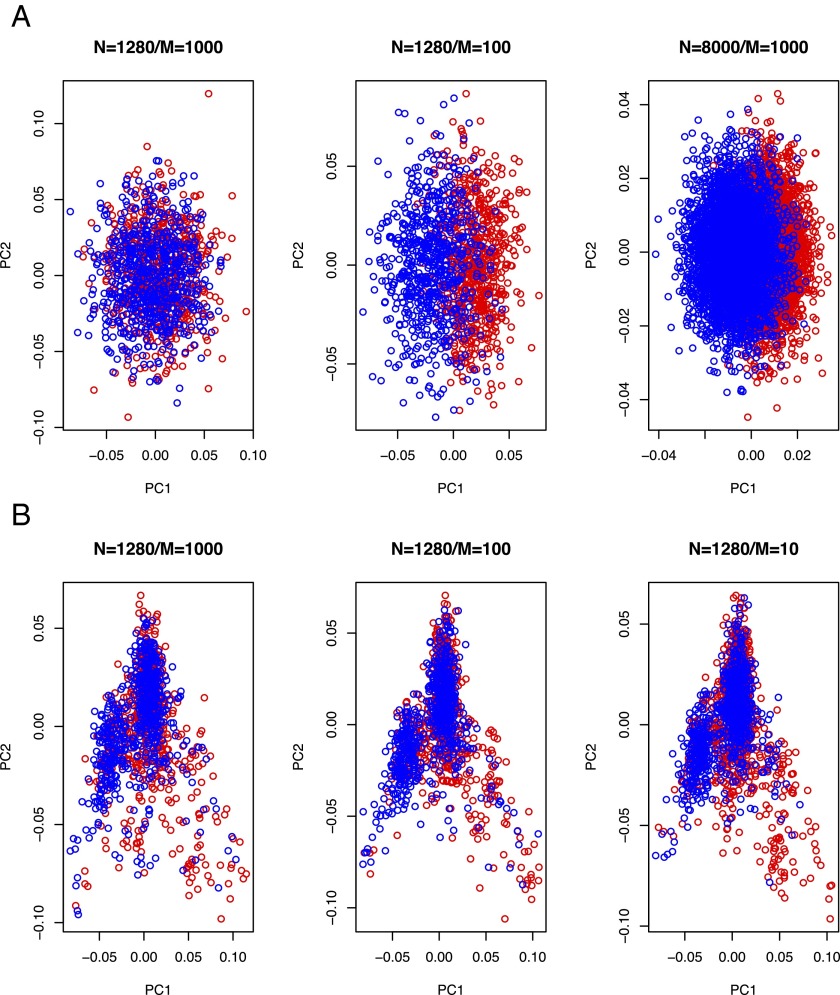
Artifactual correlation between the eigenvectors of the GRM and disease status generated from the SLES simulation. (A) With the SLES simulation, the association between the eigenvectors and case–control status is unrealistically inflated when the value for N (# individuals)/M (# SNPs) increases. The correlation between the first principal component and disease status is 0.14, 0.70, and 0.63 with the value for N/M = 1.3, 13, and 8, respectively. Population disease risk of K = 0.01 and proportion of cases in the sample of P = 0.5 were used. Red represents cases, and blue represents controls. (B) With the GLDS simulation, the association between the eigenvectors and case–control status is negligible, regardless of the values for N/M, i.e., more realistic compared with the SLES. The correlation between the first principal component and disease status is 0.04, 0.03, and 0.06, with the value for N/M = 1.3, 13, and 130, respectively (GLDS could not simulate n = 8,000, because a GWAS data set of ∼400,000 individuals would be needed; instead, we tested it with an extreme with M = 10, i.e., N/M = 130). Population disease risk of K = 0.01 and proportion of cases in the sample of P = 0.5 were used. Red represents cases, and blue represents controls.
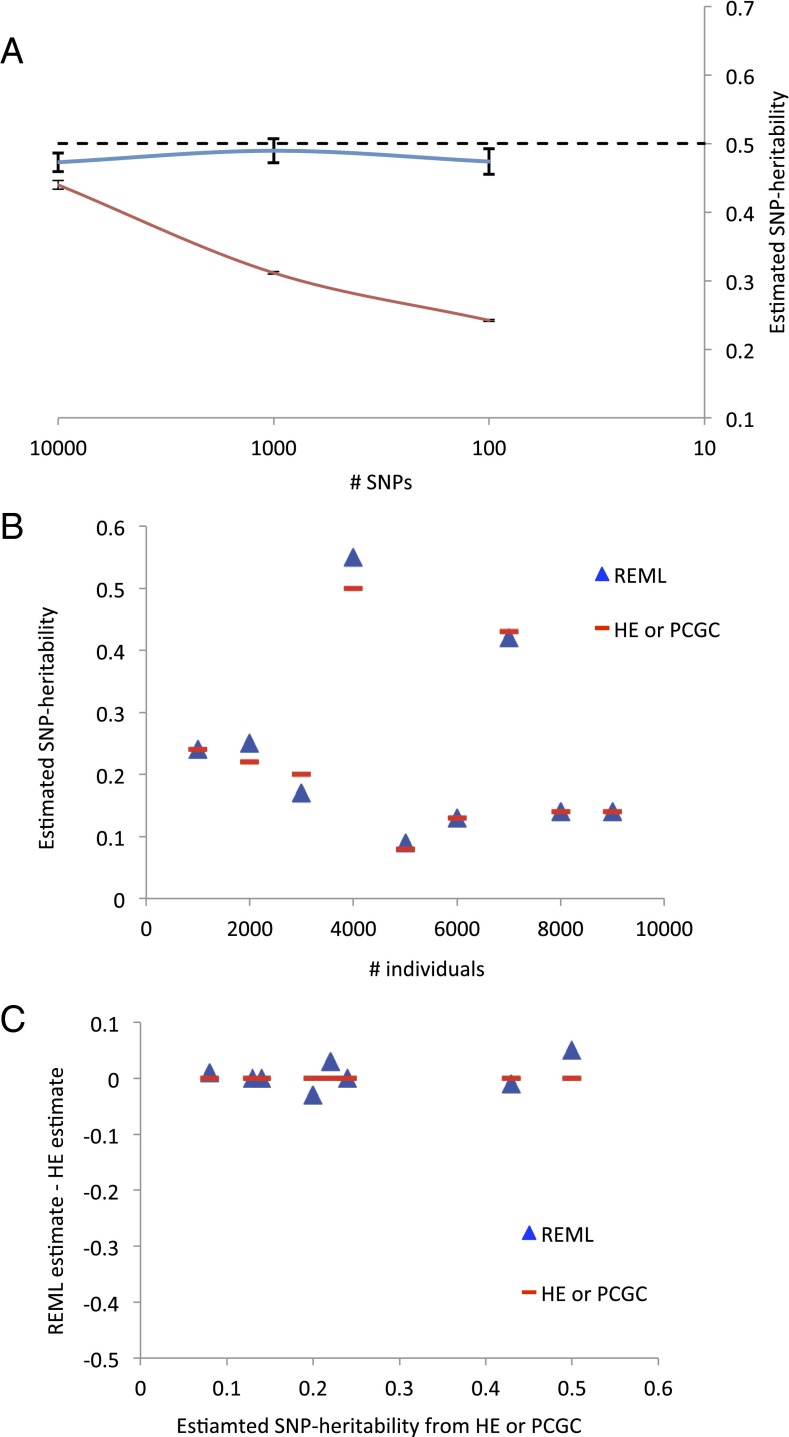
REML bias is negligible with a more realistic simulation and real data. (A) The average of estimated SNP heritability and empirical SE bar of the mean estimate from REML with GLDS simulation (blue line) and SLES simulation (red line) over 50 replicates. The true simulated SNP heritability is 0.5. (B) Estimated SNP heritability from REML and PCGC with real data analyses [to be compared with figure 2B in Golan et al. (1)]. We excluded two diseases that had highly confounded population structure [figure S1 in Gusev et al. (3)]. HE, Haseman–Elston regression. (C) Estimation error assuming that PCGC estimate is true value [to be compared with figure S4 in Golan et al. (1)].
Comment in
-
Reply to Lee: Downward bias in heritability estimation is not due to simplified linkage equilibrium SNP simulation.Proc Natl Acad Sci U S A. 2015 Oct 6;112(40):E5452-3. doi: 10.1073/pnas.1511370112. Epub 2015 Sep 28. Proc Natl Acad Sci U S A. 2015. PMID: 26417112 Free PMC article. No abstract available.
Comment on
-
Measuring missing heritability: inferring the contribution of common variants.Proc Natl Acad Sci U S A. 2014 Dec 9;111(49):E5272-81. doi: 10.1073/pnas.1419064111. Epub 2014 Nov 24. Proc Natl Acad Sci U S A. 2014. PMID: 25422463 Free PMC article.
References
-
- Gusev A, et al. Schizophrenia Working Group of the Psychiatric Genomics Consortium SWE-SCZ Consortium Schizophrenia Working Group of the Psychiatric Genomics Consortium SWE-SCZ Consortium Partitioning heritability of regulatory and cell-type-specific variants across 11 common diseases. Am J Hum Genet. 2014;95(5):535–552. - PMC - PubMed
Publication types
MeSH terms
LinkOut - more resources
Full Text Sources
Other Literature Sources
Medical
