. 2015 Sep 22:3:e1258.
doi: 10.7717/peerj.1258. eCollection 2015.

Humans differ in their personal microbial cloud

Affiliations

Humans differ in their personal microbial cloud

James F Meadow et al. PeerJ. .

Abstract

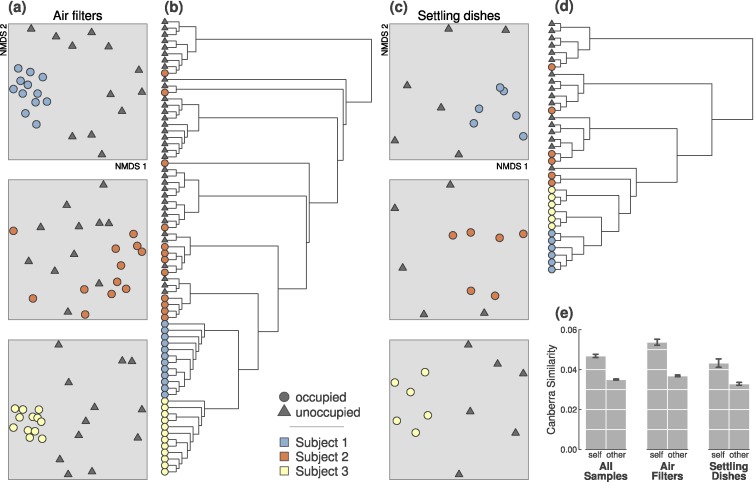
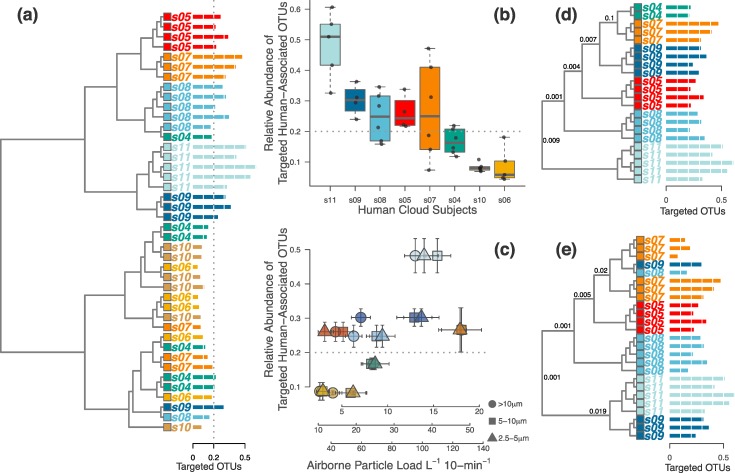
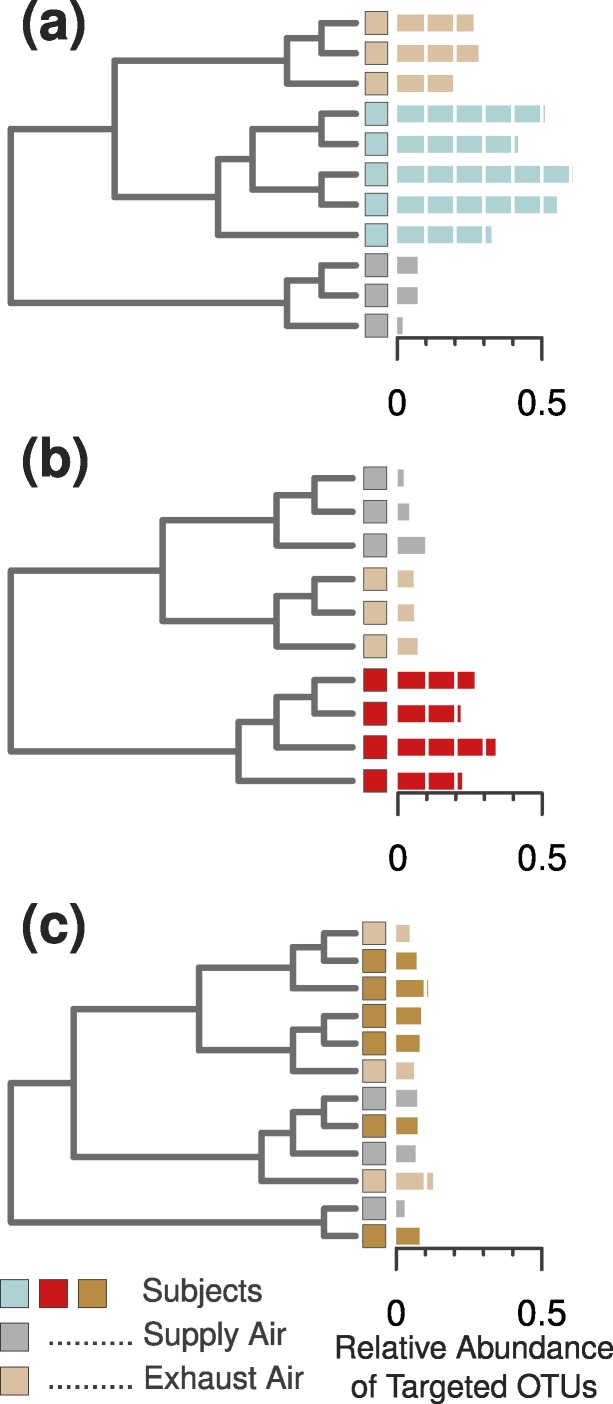
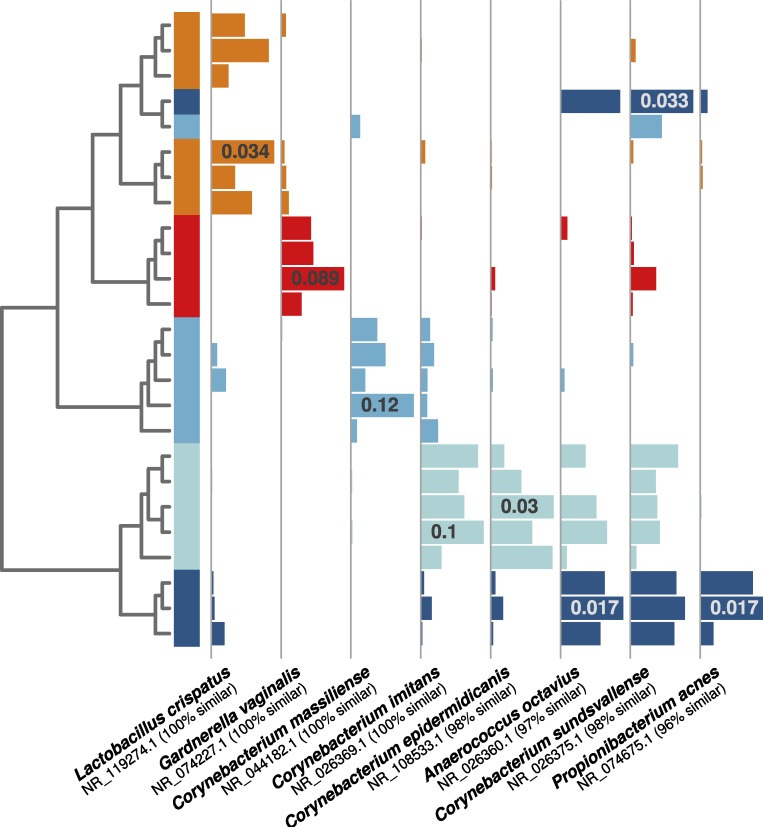
Dispersal of microbes between humans and the built environment can occur through direct contact with surfaces or through airborne release; the latter mechanism remains poorly understood. Humans emit upwards of 10(6) biological particles per hour, and have long been known to transmit pathogens to other individuals and to indoor surfaces. However it has not previously been demonstrated that humans emit a detectible microbial cloud into surrounding indoor air, nor whether such clouds are sufficiently differentiated to allow the identification of individual occupants. We used high-throughput sequencing of 16S rRNA genes to characterize the airborne bacterial contribution of a single person sitting in a sanitized custom experimental climate chamber. We compared that to air sampled in an adjacent, identical, unoccupied chamber, as well as to supply and exhaust air sources. Additionally, we assessed microbial communities in settled particles surrounding each occupant, to investigate the potential long-term fate of airborne microbial emissions. Most occupants could be clearly detected by their airborne bacterial emissions, as well as their contribution to settled particles, within 1.5-4 h. Bacterial clouds from the occupants were statistically distinct, allowing the identification of some individual occupants. Our results confirm that an occupied space is microbially distinct from an unoccupied one, and demonstrate for the first time that individuals release their own personalized microbial cloud.

Keywords: Built environment; Human microbiome; Indoor air; Indoor microbiology; Microbial cloud.


Conflict of interest statement

Jessica Green is an Academic Editor for PeerJ.

Figures

Figure 1
Figure 1. Occupied and unoccupied bioaerosols during the first experiment were significantly different, and occupants were distinguishable during all 4-hour sampling periods.
(A) All three occupants were discernible from simultaneously unoccupied air (all p-values = 0.001). Ordination plots are 2-dimensional NMDS from Canberra distances. (B) Occupants were distinguishable from one another based on bacteria collected in air filters (p-value = 0.001). (C) Occupants were discernible from unoccupied samples based on bacteria collected in settling dishes (p-values = 0.003, 0.044, and 0.005; for Subjects 1, 2, and 3). (D) Settled particles from each occupant were somewhat less consistently identifiable, even though the three occupants were significantly different (p-value = 0.001). (E) Occupant microbial clouds were more similar to other samples from the same person than to other occupants, regardless of sampling method. This difference was significantly more pronounced than that of unoccupied samples taken simultaneously during sampling periods (Fig. S1). Error bars represent ±1 standard error on pairwise Canberra similarities.
Figure 2
Figure 2. Half of the occupants in the second experiment were clearly distinguishable, but this depended on the magnitude of human-associated bacteria shed during occupation.
(A) When analyzing only the targeted human-associated bacterial taxa, only samples in the top half of the dendrogram tended to be correctly classified together. Those samples that failed to cluster together were generally below the apparent 20% human-associated threshold (gray dotted line). Each tip on the tree is a separate sample from a single occupant (subject s04-s11). Each occupant is a different color, and the colors correspond with Figs. 3 and 4. Horizontal bars (identical to those used in D & E) show the proportion of targeted human-associated bacterial OTUs in each sample. These same values are shown as the y-axes in B & C. (B) Each occupant yielded a consistent proportion of human-associated taxa. (C) Airborne particle counts (x-axis) correlate with the proportion of airborne human-associated taxa detected around each occupant (y-axis). (D) When the dataset was limited to only those samples above the 20% threshold, all samples cluster appropriately by individual human subject. (E) Alternatively, if limiting the dataset to only those occupants whose median sample proportion was above 20%, results were nearly identical except for two misclassifications. P-values shown at major nodes in D & E are from PERMANOVA tests on separation of individual clades.
Figure 3
Figure 3. Three example cases of detectability in the occupied chamber and the exhaust ventilation system.
(A) Subject 11 was an example of ideal detection in the ventilation system—we were able to find sufficient human-associated OTU concentrations to correctly classify the air leaving the occupied chamber. (B) Most occupants, however, did not emit sufficient bacterial concentrations to be detected in the ventilation system, even when they were readily detected within the occupied chamber. (C) Two subjects emitted nearly undetectable concentrations of particles (Fig. 2C) and human-associated bacterial OTUs (Fig. 2B), and were thus impossible to detect or identify in either the occupied chamber or the exhaust ventilation system.
Figure 4
Figure 4. Individual human-associated bacterial OTUs helped to distinguish occupants.
When considering the five most statistically distinguishable occupants (cluster diagram from Fig. 2E), each was associated with a set of significant indicator OTUs, and eight examples are shown here. Each was (A) significantly associated with an occupant (all p-values <0.01), (B) among the 10 most abundant for that given occupant, and (C) among the 50 most abundant targeted OTUs in the whole dataset. Horizontal bars show each OTU’s relative abundance, with maximum relative abundance shown in a single bar. OTU names matched from the NCBI 16S isolate database are given below each set of bars.

References

    1. Adams R, Miletto M, Taylor J, Bruns T. Dispersal in microbes: fungi in indoor air are dominated by outdoor air and show dispersal limitation at short distances. ISME Journal. 2013;7:1262–1273. doi: 10.1038/ismej.2013.28. - DOI - PMC - PubMed
    1. Adams RI, Bhangar S, Pasut W, Arens EA, Taylor JW, Lindow SE, Nazaroff WW, Bruns TD. Chamber bioaerosol study: outdoor air and human occupants as sources of indoor airborne microbes. PLoS ONE. 2015;10(5):e1258. doi: 10.1371/journal.pone.0128022. - DOI - PMC - PubMed
    1. Bhangar S, Adams RI, Pasut W, Huffman JA, Arens EA, Taylor JW, Bruns TD, Nazaroff WW. Chamber bioaerosol study: human emissions of size-resolved fluorescent biological aerosol particles. Indoor Air. 2015 doi: 10.1111/ina.12195. Epub ahead of print Mar 14 2015. - DOI - PubMed
    1. Bowers R, McCubbin I, Hallar A, Fierer N. Seasonal variability in airborne bacterial communities at a high-elevation site. Atmospheric Environment. 2012;50:41–49. doi: 10.1016/j.atmosenv.2012.01.005. - DOI
    1. Bowers R, McLetchie S, Knight R, Fierer N. Spatial variability in airborne bacterial communities across land-use types and their relationship to the bacterial communities of potential source environments. ISME Journal. 2011;5:601–612. doi: 10.1038/ismej.2010.167. - DOI - PMC - PubMed