. 2015 Sep 29;10(9):e0138107.
doi: 10.1371/journal.pone.0138107. eCollection 2015.

Visualization of Active Glucocerebrosidase in Rodent Brain with High Spatial Resolution following In Situ Labeling with Fluorescent Activity Based Probes

Affiliations

Visualization of Active Glucocerebrosidase in Rodent Brain with High Spatial Resolution following In Situ Labeling with Fluorescent Activity Based Probes

Daniela Herrera Moro Chao et al. PLoS One. .

Abstract

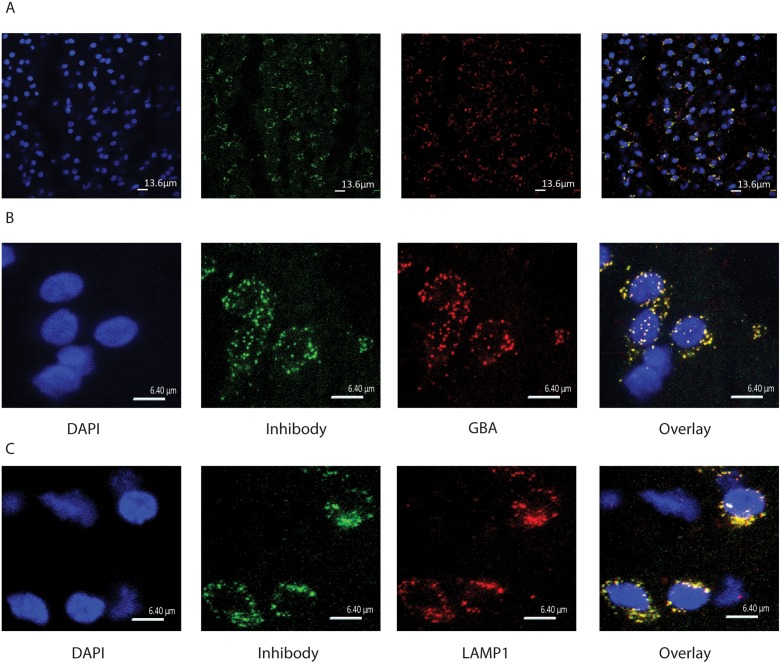
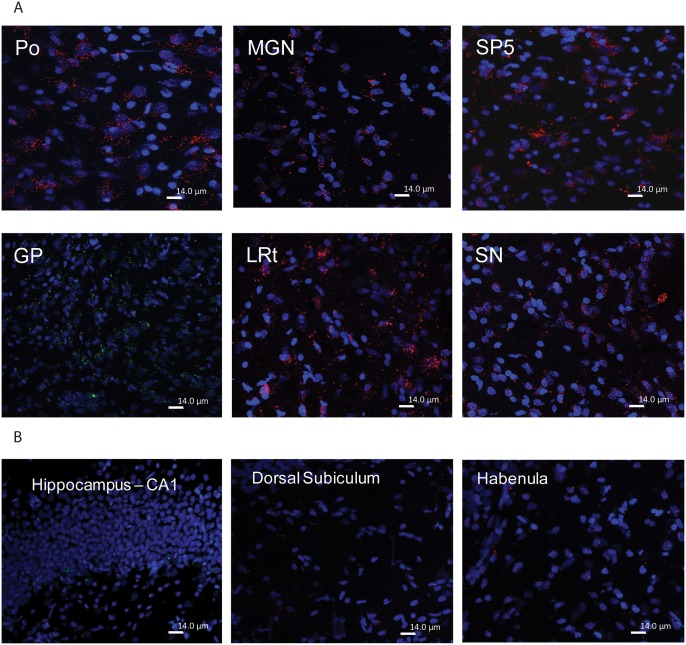
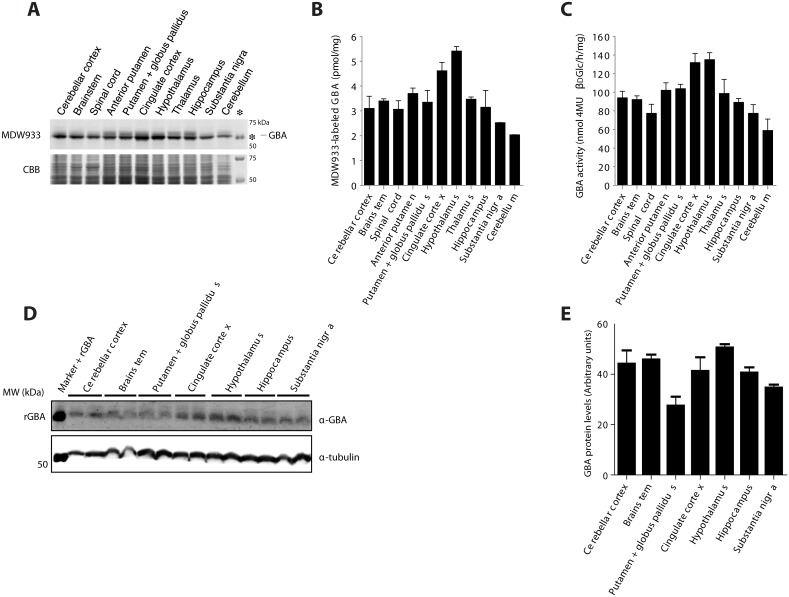
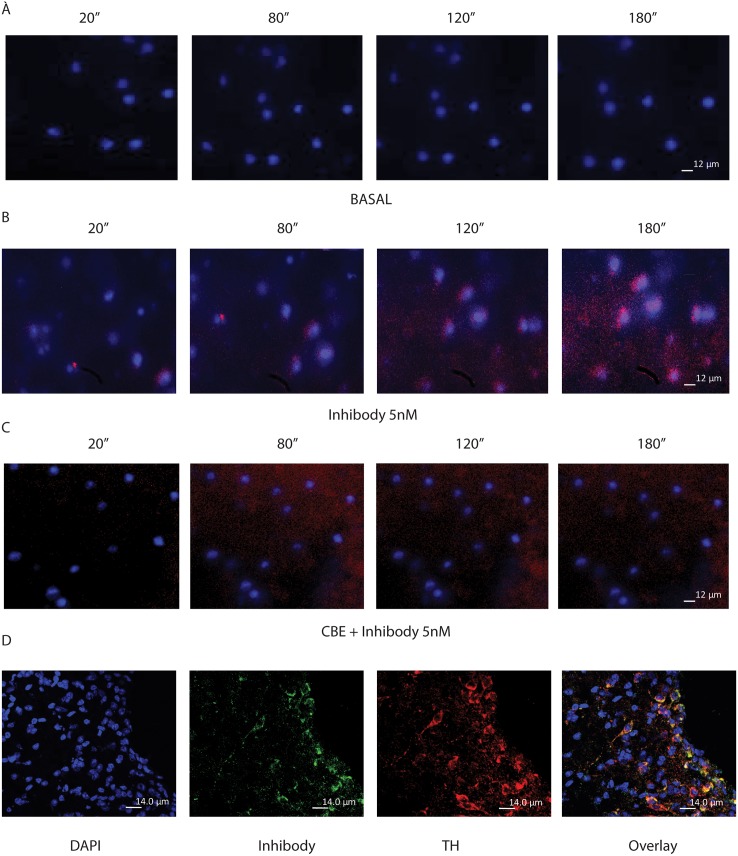
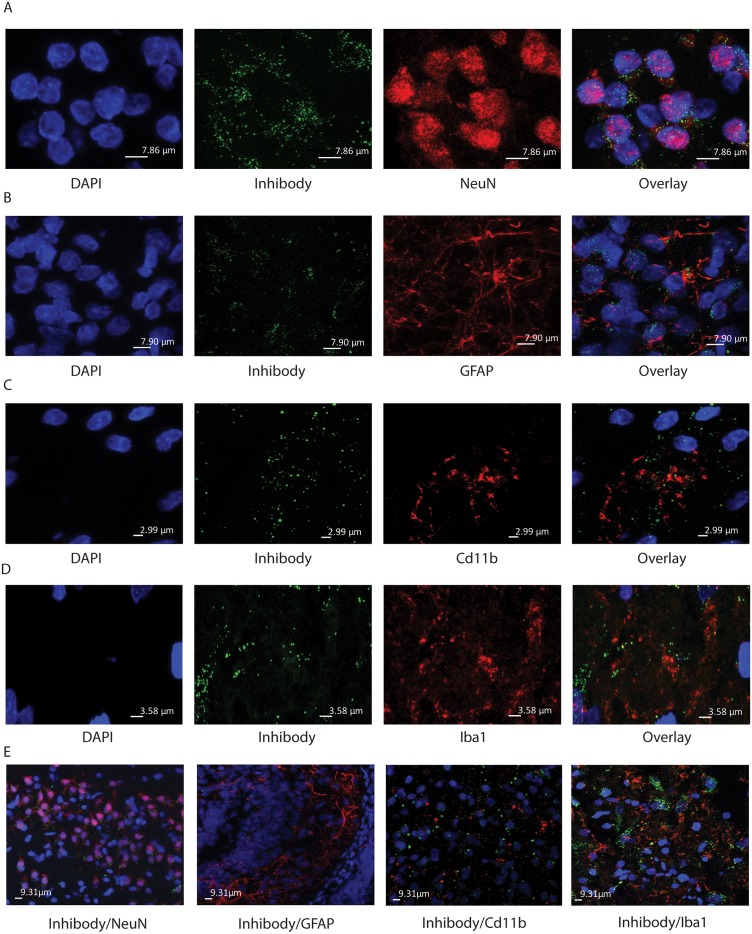
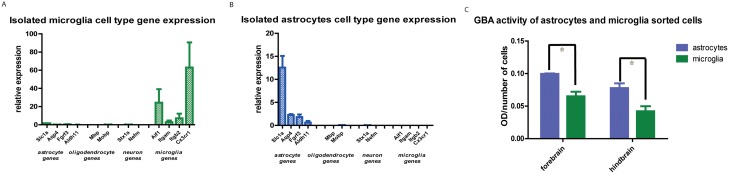
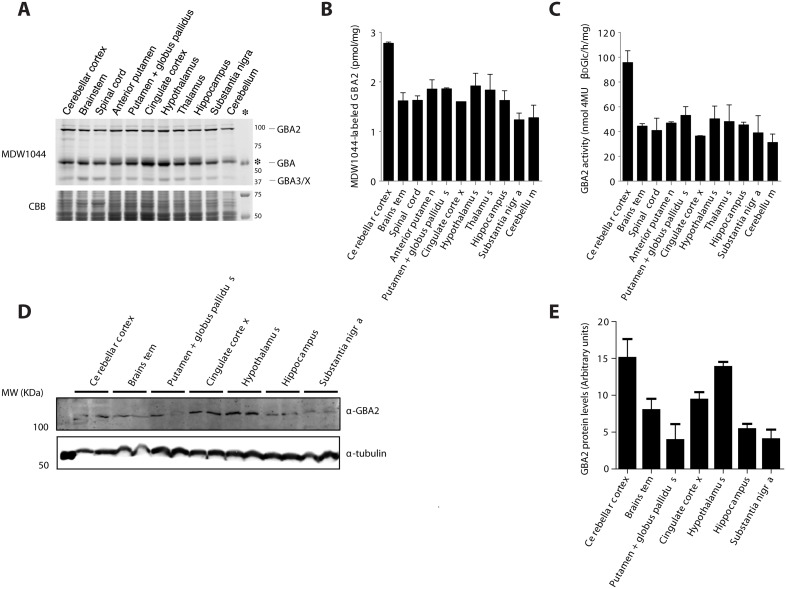
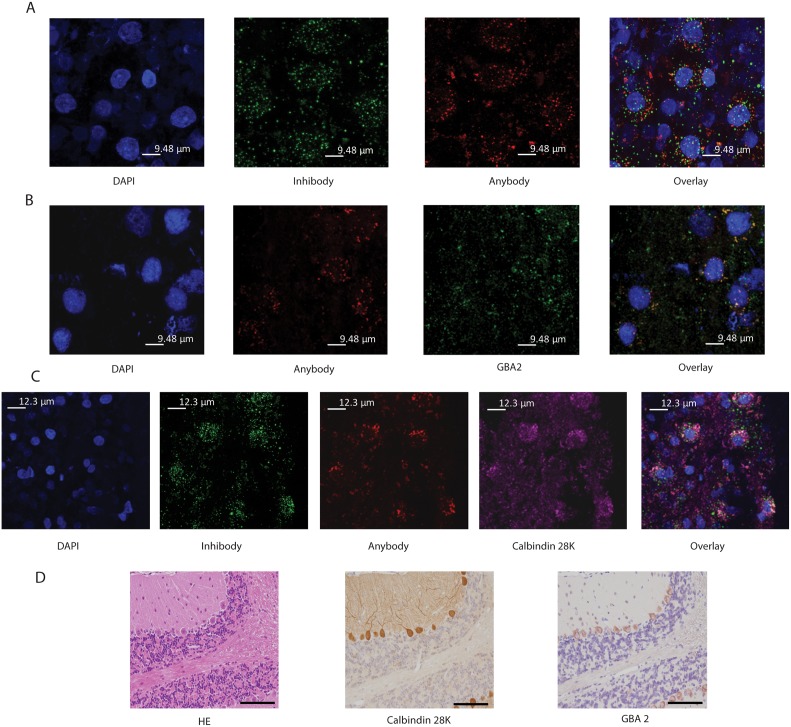
Gaucher disease is characterized by lysosomal accumulation of glucosylceramide due to deficient activity of lysosomal glucocerebrosidase (GBA). In cells, glucosylceramide is also degraded outside lysosomes by the enzyme glucosylceramidase 2 (GBA2) of which inherited deficiency is associated with ataxias. The interest in GBA and glucosylceramide metabolism in the brain has grown following the notion that mutations in the GBA gene impose a risk factor for motor disorders such as α-synucleinopathies. We earlier developed a β-glucopyranosyl-configured cyclophellitol-epoxide type activity based probe (ABP) allowing in vivo and in vitro visualization of active molecules of GBA with high spatial resolution. Labeling occurs through covalent linkage of the ABP to the catalytic nucleophile residue in the enzyme pocket. Here, we describe a method to visualize active GBA molecules in rat brain slices using in vivo labeling. Brain areas related to motor control, like the basal ganglia and motor related structures in the brainstem, show a high content of active GBA. We also developed a β-glucopyranosyl cyclophellitol-aziridine ABP allowing in situ labeling of GBA2. Labeled GBA2 in brain areas can be identified and quantified upon gel electrophoresis. The distribution of active GBA2 markedly differs from that of GBA, being highest in the cerebellar cortex. The histological findings with ABP labeling were confirmed by biochemical analysis of isolated brain areas. In conclusion, ABPs offer sensitive tools to visualize active GBA and to study the distribution of GBA2 in the brain and thus may find application to establish the role of these enzymes in neurodegenerative disease conditions such as α-synucleinopathies and cerebellar ataxia.


Conflict of interest statement

Competing Interests: JA and HO are inventors on a patent application on cyclophellitol-epoxide ABP. Name of the patent: Activity Based Probes (ABPS0 interacting with glycosidases). Inventors: J.M.F.G. Aerts & H.S. Overkleeft. US Patent no: US 9,056,847 B2 (date of patent Jun. 16, 2015). There are no further patents, products in development or marketed products to declare. This does not alter the authors' adherence to all the PLOS ONE policies on sharing data and materials.

Figures

Fig 1
Fig 1. Cyclophellitol-epoxide ABP MDW933 administered i.c.v. labels specifically lysosomal GBA in the brain.
(A) 63x Confocal images showing from left to right: DAPI stain, MDW933 (green Inhibody) labeling, GBA antibody labeling (red) and their overlay in the Po of the brainstem. (B) Zoom (3x) 63x confocal images showing clear colocalization. (C) Zoom (3x) 63x confocal images showing from left to right: DAPI stain, green MDW933, the lysosomal protein LAMP1 antibody labeling (red) and their overlay in the Po of the brainstem.
Fig 2
Fig 2. Prominent GBA-labeling by infused inhibody ABPs in motor related areas of the brain.
(A) Strong red MDW941 labeling of brainstem motor related structures Po, SP5, Lrt, SN and MGN after i.c.v. administration. Example of green MDW933 labeling of GP (middle panel left). (B) Modest labeling of motivational and memory processing areas. Example of modest MDW933 labeling of hippocampus (left panel) and modest MDW941 labeling of dorsal subiculum, and habenular (middle and right panel).
Fig 3
Fig 3. Active GBA in specific brain areas.
(A) SDS-PAGE gel of Inhibody MDW933 labeled rat brains areas. The asterisk indicates positive control recombinant GBA signal. As a loading control the same gel was stained with Coomassie brilliant blue (CBB). (B) Quantification of fluorescence expressed per μg of total protein. (C) Enzymatic activity of GBA in brain areas, as determined with 4MU-β-d-glucopyranoside substrate. (D) GBA protein levels in homogenates of rat brain areas assessed by Western blot analysis. (E) Quantification of GBA blot in rat brain areas normalized to tubulin.
Fig 4
Fig 4. Ex vivo live imaging of GBA labeling in the SN.
(A) Ex vivo live imaging of DAPI-stained SN during 10 minutes with a 20 second interval per picture. (B) Ex vivo live imaging of the SN after 5 nM MDW941 administration to the media. (C) Ex vivo live imaging of the SN after incubation with CBE followed by Inhibody addition to the media. (D) TH antibody staining of SN slices after ABP labeling.
Fig 5
Fig 5. Presence of active GBA in neurons.
Shown is zooming (3×) of 63× confocal images in A-C. (A) SN of i.c.v. infused rats with MDW933. From left to right images of DAPI, green MDW933, red NeuN antibody staining and overlay image. The overlay shows the Inhibody label around NeuN positive nuclei of neuronal cell suggesting lysosomal localization. (B) Median Eminence (ME) of i.c.v. infused rats with MDW933. From left to right images of DAPI, green MDW933, red GFAP antibody and overlay image. The overlay shows GFAP positive cells with concomitant Inhibody labeling. (C) SN of i.c.v. infused rats with MDW933. From left to right images of DAPI, green MDW933, red CD11b antibody and overlay image. The overlay shows MDW933 signal in areas containing microglia cells. (D) SN of i.c.v. infused rats with MDW933. From left to right images of DAPI, green MDW933, red Iba1 antibody and overlay image. The overlay shows MDW933 signal in areas containing microglia cells. (E) 63x confocal images of the SN and ME of i.c.v. infused rats with MDW933. The images show from left to right green MDW933 and red NeuN antibody (SN); green Inhibody and red GFAP antibody (ME); green Inhibody and red CD11b antibody (SN); green Inhibody and red Iba1 antibody (SN).
Fig 6
Fig 6. GBA in sorted CD11b positive microglia and GLT1 positive astrocyte populations.
(A) RT PCR mRNA expression of CD11b positive sorted cells. (B) RT PCR mRNA expression of GLT1 positive sorted cells. (C). Quantification of green MDW933-labeled GBA in microglia and astrocytes expressed per number of cells.
Fig 7
Fig 7. In vitro labeling of GBA2 in specific brain areas.
(A) SDS-PAGE gel of Anybody MDW1044 labeled rat brains areas. (B) Quantification of Anybody MDW1044 fluorescent signal per μg of protein. (C) GBA2 enzymatic activity in different brain areas. (D) GBA2 protein levels in homogenates of rat brain areas assessed by Western blot analysis. (E) Quantification of GBA2 blot in rat brain areas normalized to the same tubulin signal showed in Fig 3e. Note: cerebellum indicates other parts of cerebellum than cerebellar cortex.
Fig 8
Fig 8. Labeling of cerebellar cortex with β-aziridine cyclophellitol ABP JJB75.
(A) Zoom (3x) of 63x confocal images of the cerebellar cortex of green Inhibody MDW933 > red Anybody JJB75 i.c.v. infused animals. From left to right images of DAPI, green MDW933 signal, and red JJB75 signal are shown. The overlay shows that Inhibody and Anybody signals colocalize to only a minor extent. (B) Zoom (3x) of 63x confocal image. Cerebellar Cortex of CBE > red Anybody JJB75 i.c.v. infused animals. From left to right images of DAPI, red JJB75, anti-GBA2 antibody signal (green) and overlay image are shown. (C) Zoom (3x) of 63x confocal images of the cerebellar cortex of Inhibody MDW933 > Anybody JJB75 i.c.v. infused animals. From left to right images of DAPI, green MDW933, red JJB75, Calbindin 28K antibody staining (magenta) and overlay image are shown. (D) GBA2 presence in Purkinje cells in mouse brain. From left to right: HE staining, Calbindin 28K antibody staining and anti-GBA2 antibody staining in separate sections.

References

    1. Beutler E, Grabowski GA. Gaucher disease, The Metabolic and Molecular Bases of Inherited Disease (8th ed.). New York: Scriver CR, Sly WS, Valle D. (Eds.), McGraw-Hill, 2001; 3635–3668.
    1. van Weely S, Brandsma M, Strijland A, Tager JM, Aerts JM. Demonstration of the existence of a second, non-lysosomal glucocerebrosidase that is not deficient in Gaucher disease. Biochim Biophys Acta 1993; 1181:55–62. - PubMed
    1. Xu YH, Sun Y, Ran H, Quinn B, Witte D, Grabowski GA. Accumulation and distribution of α-synuclein and ubiquitin in the CNS of Gaucher disease mouse models. Mol Genet Metab 2011; 102:436–447. 10.1016/j.ymgme.2010.12.014 - DOI - PMC - PubMed
    1. Wong K, Sidransky E, Verma A, Mixon T, Sandberg GD, Wakefield LK, et al. Neuropathology provides clues to the pathophysiology of Gaucher disease. Mol Genet Metab 2004; 82:192–207. - PubMed
    1. Westbroek W, Gustafson AM, Sidransky E. Exploring the link between glucocerebrosidase mutations and Parkinsonism. Trends Mol Med 2011; 17:485–93. 10.1016/j.molmed.2011.05.003 - DOI - PMC - PubMed

Publication types

MeSH terms