Case Reports
. 2015 Dec;78(6):982-994.
doi: 10.1002/ana.24535. Epub 2015 Nov 13.

TPM3 deletions cause a hypercontractile congenital muscle stiffness phenotype

Affiliations
Case Reports

TPM3 deletions cause a hypercontractile congenital muscle stiffness phenotype

S Donkervoort et al. Ann Neurol. 2015 Dec.

Abstract

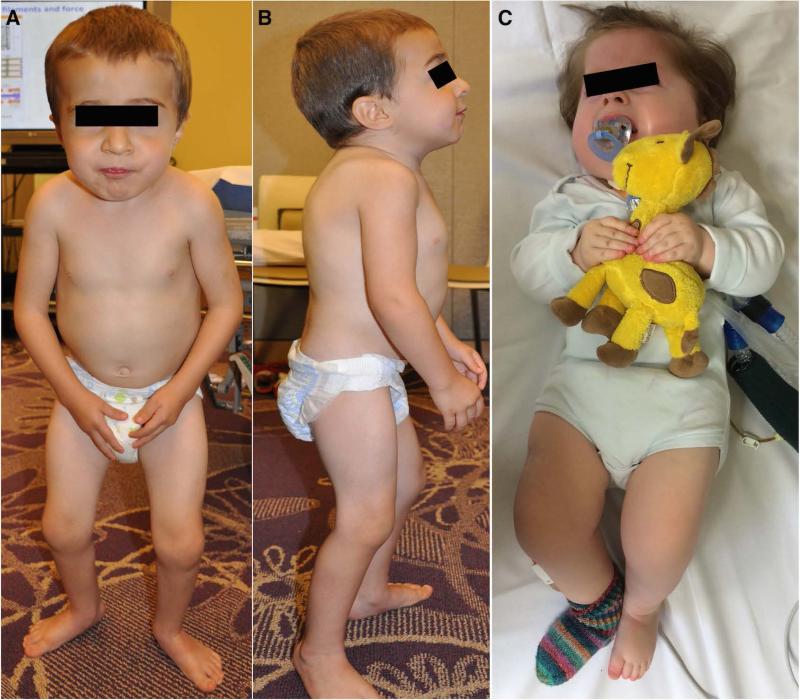
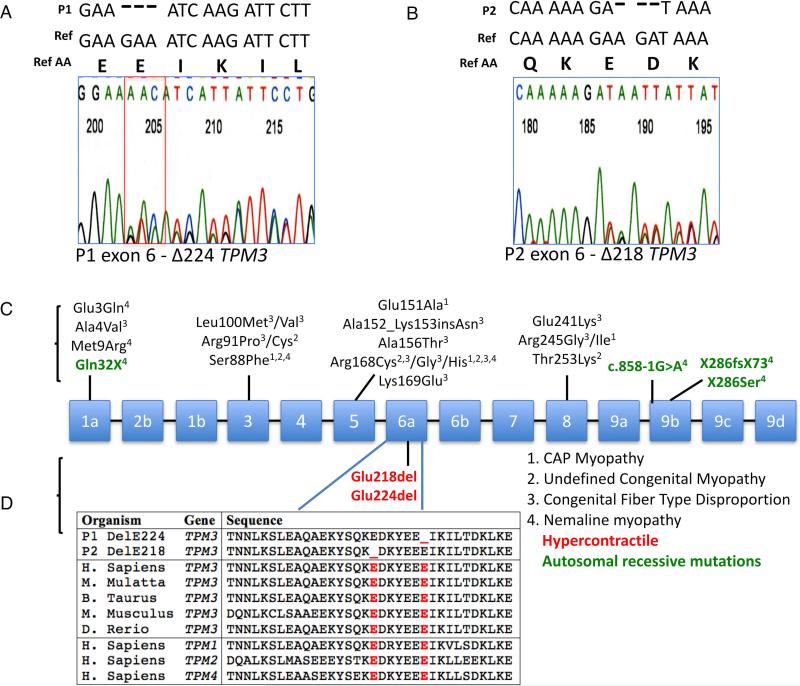
Objective: Mutations in TPM3, encoding Tpm3.12, cause a clinically and histopathologically diverse group of myopathies characterized by muscle weakness. We report two patients with novel de novo Tpm3.12 single glutamic acid deletions at positions ΔE218 and ΔE224, resulting in a significant hypercontractile phenotype with congenital muscle stiffness, rather than weakness, and respiratory failure in one patient.

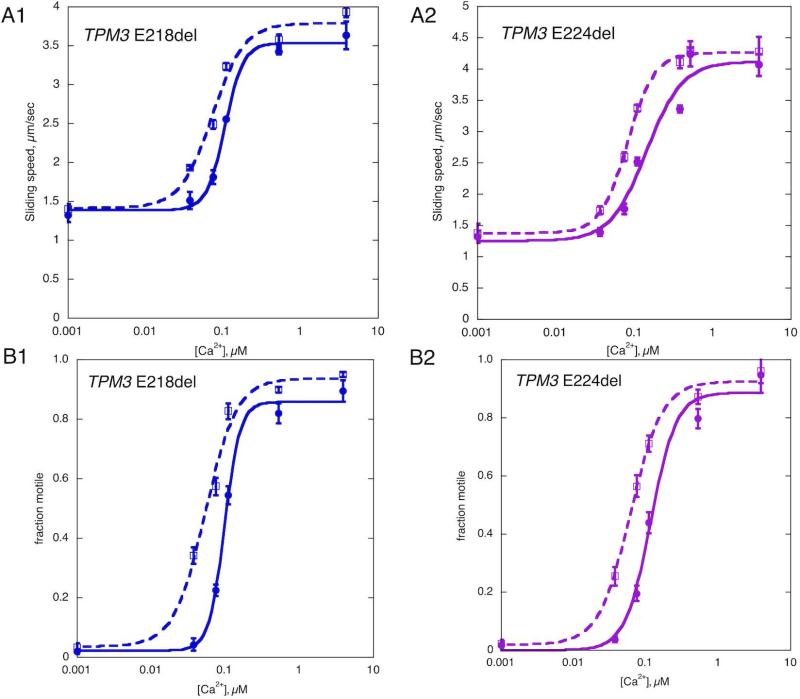
Methods: The effect of the Tpm3.12 deletions on the contractile properties in dissected patient myofibers was measured. We used quantitative in vitro motility assay to measure Ca(2+) sensitivity of thin filaments reconstituted with recombinant Tpm3.12 ΔE218 and ΔE224.

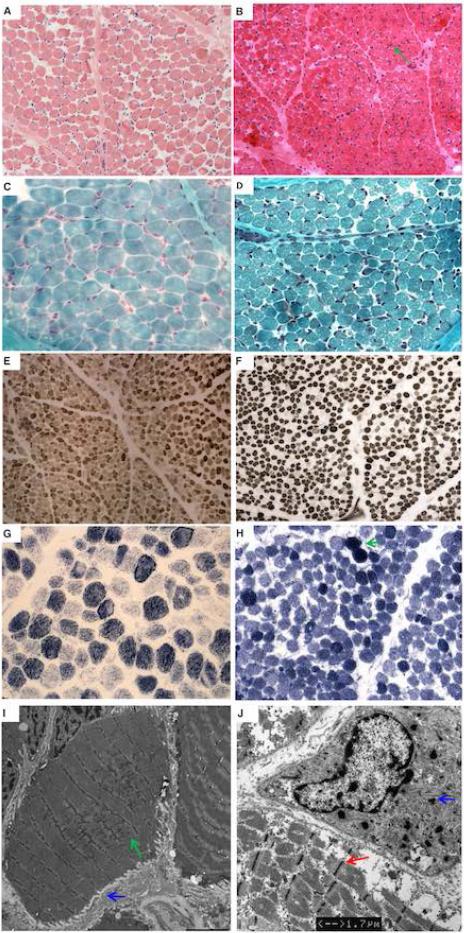
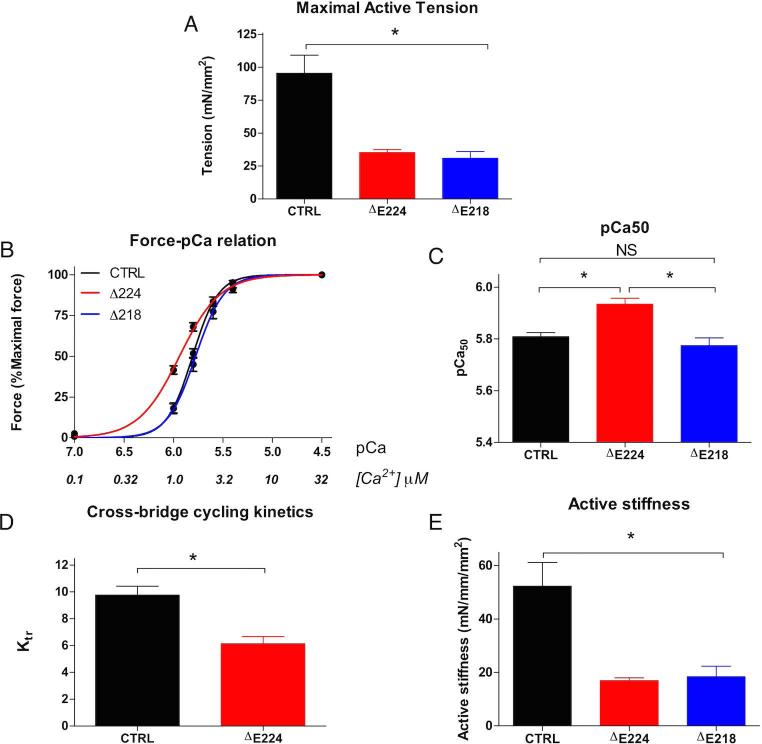
Results: Contractility studies on permeabilized myofibers demonstrated reduced maximal active tension from both patients with increased Ca(2+) sensitivity and altered cross-bridge cycling kinetics in ΔE224 fibers. In vitro motility studies showed a two-fold increase in Ca(2+) sensitivity of the fraction of filaments motile and the filament sliding velocity concentrations for both mutations.

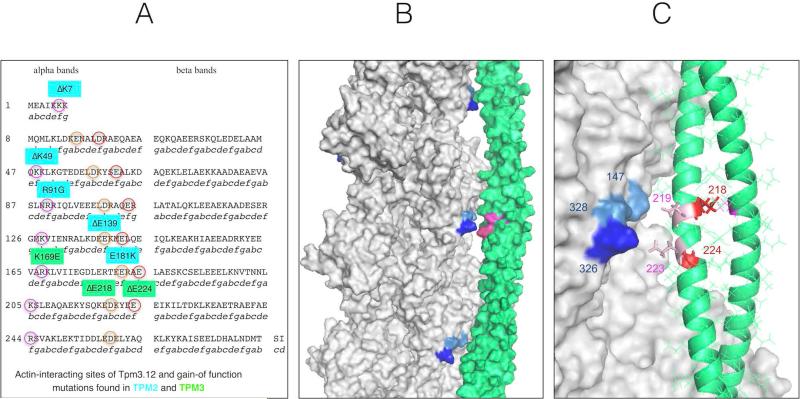
Interpretation: These data indicate that Tpm3.12 deletions ΔE218 and ΔE224 result in increased Ca(2+) sensitivity of the troponin-tropomyosin complex, resulting in abnormally active interaction of the actin and myosin complex. Both mutations are located in the charged motifs of the actin-binding residues of tropomyosin 3, thus disrupting the electrostatic interactions that facilitate accurate tropomyosin binding with actin necessary to prevent the on-state. The mutations destabilize the off-state and result in excessively sensitized excitation-contraction coupling of the contractile apparatus. This work expands the phenotypic spectrum of TPM3-related disease and provides insights into the pathophysiological mechanisms of the actin-tropomyosin complex.


Figures

Figure 1
Figure 1
(A and B). 4 year old male (P1) with relative macrocephaly compared to his short stature and thin habitus. He has a prominent forehead, small mouth, short neck and stiff face. His shoulders are anteriorly rotated with decreased lumbar lordosis and increased kyphosis and he has bilateral elbow and knee contractures. He has flat feet that are turned outwards, external hip rotation and a barrel chest with wide spaced nipples. (C). 3-year-old female (P2) with pronounced muscle stiffness. She has bilateral contractures of elbows, knees and ankles. She is ventilated with tracheostomy and has a feeding tube.
Figure 2
Figure 2
Sequence chromatogram of P1 & P2 identifying a glutamic acid deletion in Tpm3.12. (A and B). Schematic of known mutations in TPM3 along with their disease phenotypes (C). Illustration of amino acid homology of TPM3, P1, P2 as well as for TPM1, 2 & 4 (D).
Figure 3
Figure 3
Muscle biopsy of P1 at age 17 months (left) and P2 at age 22 days (right). H&E at (at 20x) shows variability in fiber size with increased perimysial and endomysial fibrosis in P1 (A) and P2 (B). There are some rare basophilic fibers in P2 (B) with centrally placed nuclei (green arrow). Trichrome staining (at 40x) does not show inclusions suggestive of nemaline rods or vacuoles in P1 (C) while P2 shows “miliary” rod-like inclusions in some of the atrophic fibers (D). There is variation in fiber size of both fiber types on ATPase 9 (at 20x) in P1 (E) and ATPase 10.5 (at 20x) in P2 (F). There is mild type 1 predominance in P1 and mild type 2 fiber predominance in P2. NADH (at 40x) in P1 (G) and P2 (H) shows a decrease in staining in the periphery of some of the darker (type I) fibers, evidence of mitochondrial aggregation and contracted fibers (green arrow). EM of P1 shows and atrophic muscle fiber with Z-disk streaming (green arrow) and sarcolemmal folds (blue arrow) (I) (bar = 4 μm). EM of P2 also shows Z-band broadening in an atrophic fiber (red arrow) (bar = 1.7 μm). There are some “miliary” rods (blue arrow). No clear nemaline rods were seen (J).
Figure 4
Figure 4
Ca2+ control of in vitro motility. Representative Ca2+-activation curves; ΔE218 left and ΔE224 on right compared with wild-type control. Thin filaments were assembled using baculovirus expressed Tpm3.12, rabbit skeletal muscle actin and rabbit skeletal muscle troponin. Thin filament movement over immobilized HMM was tracked and analyzed over a range of Ca2+ concentrations. Solid lines, control; dotted lines mutant tropomyosin. Error bars are SD for 4 measurements of motility in the same motility cell. The curves are the fits of the data to the Hill equation; sliding speed (top) and fraction of filaments motile parameters (bottom). Four separate Ca2+-curves were determined for each mutation. For WT and ΔE218 EC50 for fraction motile were 0.20±0.06 and 0.07±0.02 respectively, for sliding speed 0.22±0.08 and 0.08±0.01 respectively. For WT and ΔE224 EC50 for fraction motile were 0.19±0.05 and 0.07±0.021 respectively, for sliding speed 0.30±0.08 and 0.09±0.02 respectively.
Figure 5
Figure 5
A significant decrease in maximum force generation was seen in single fiber myofibres from Tpm3.12 ΔE224 & ΔE218 compared to controls (A). The Ca2+ sensitivity of force generation was increased in ΔE224 compared to controls and ΔE218 (B and C). Additionally there is reduced cross-bridge cycling kinetics in Tpm3.12 ΔE224 (D) while the active stiffness was not altered between Tpm3.12 ΔE224 and control (E).
Figure 6
Figure 6
Location of gain-of function mutations in tropomyosin isoforms Tpm2.2 and Tpm3.12. The amino acids predicted to interact with actin are circled (A). Structure of the F-actin-tropomyosin complex determined by Li et al (2011). Surface rendering using PyMol. Actin K326, K328 and R147 are shown in different shades of blue and tropomyosin 218,219 223 and 224 are shown in magenta (B). The interface of tropomyosin period 6 with actin. Actin K326, K328 and R147 are shown in different shades of blue, E214 and E224 in red and 219 and 223 are shown in pink. Actin is represented by surface rendering; the secondary structure of tropomyosin backbone (coiled-coil alpha helix) is shown with the side chains in line notation (C).

References

    1. Perry SV. Vertebrate tropomyosin: Distribution, properties and function. J. Muscle Res. Cell Motil. 2001;22:5–49. - PubMed
    1. Murakami K, Stewart M, Nozawa K, et al. Structural basis for tropomyosin overlap in thin (actin) filaments and the generation of a molecular swivel by troponin-T. Proc. Natl. Acad. Sci. U. S. A. 2008;105:7200–7205. - PMC - PubMed
    1. De Paula AM, Franques J, Fernandez C, et al. A TPM3 mutation causing cap myopathy. Neuromuscul. Disord. 2009;19:685–688. - PubMed
    1. Ohlsson M, Fidzianska A, Tajsharghi H, Oldfors A. TPM3 mutation in one of the original cases of cap disease. Neurology. 2009;72(22):1961–3. - PubMed
    1. Schreckenbach T, Schröder JM, Voit T, et al. Novel TPM3 mutation in a family with cap myopathy and review of the literature. Neuromuscul. Disord. 2014;24(2):117–24. - PubMed

Publication types