. 2015 Sep 30:3:42.
doi: 10.1186/s40168-015-0106-5.

Cultivation of stable, reproducible microbial communities from different fecal donors using minibioreactor arrays (MBRAs)

Affiliations

Cultivation of stable, reproducible microbial communities from different fecal donors using minibioreactor arrays (MBRAs)

Jennifer M Auchtung et al. Microbiome. .

Abstract

Background: Continuous-flow culture models are one tool for studying complex interactions between members of human fecal microbiotas because they allow studies to be completed during an extended period of time under conditions where pH, nutrient availability, and washout of waste products and dead cells can be controlled. Because many of the existing well-validated continuous-flow models are large and complex, we were interested in developing a simpler continuous-flow system that would allow microbial community dynamics to be examined in higher throughput while still maintaining complex microbial communities. To this end, we developed minibioreactor arrays (MBRAs), small volume bioreactors (15 ml) that allow simultaneous cultivation of up to 48 microbial communities in a single anaerobic chamber.

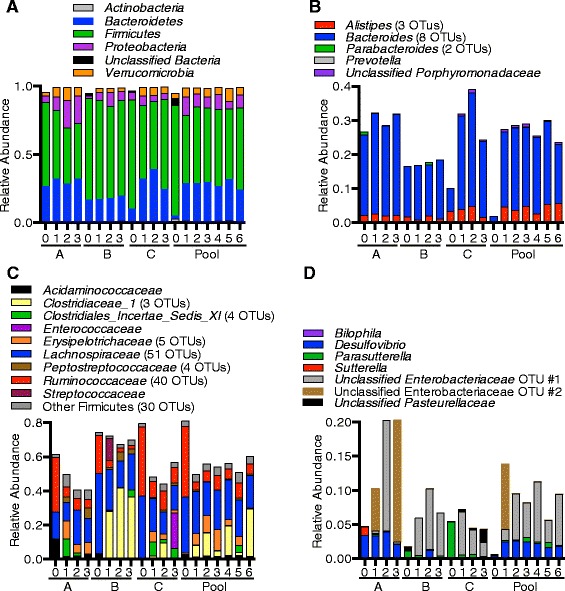
Results: We used MBRA to characterize the microbial community dynamics of replicate reactors inoculated from three different human fecal donors and reactors seeded with feces pooled from these three donors. We found that MBRA could be used to efficiently cultivate complex microbial communities that were a subset of the initial fecal inoculum (15-25 % of fecal OTUs initially observed). After an initial acclimation period of approximately 1 week, communities in each reactor stabilized and exhibited day-to-day variation similar to that observed in stable mouse fecal communities. Replicate reactors were predominately populated by shared core microbial communities; variation between replicate reactors was primarily driven by shifts in abundance of shared operational taxonomic units (OTUs). Consistent with differences between fecal donors, MBRA communities present in reactors seeded with different fecal samples had distinct composition and structure.

Conclusions: From these analyses, we conclude that MBRAs can be used to cultivate communities that recapitulate key features of human fecal communities and are a useful tool to facilitate higher-throughput studies of the dynamics of these communities.


Figures

Fig. 1
Fig. 1
Impact of MBRA cultivation on microbial diversity. Microbial diversity of triplicate MBRA communities inoculated with one of three donor fecal samples (Donor A, blue circles; Donor B, green circles; Donor C, purple circles) or in six replicate MBRA communities inoculated with an equal mass of all three donor fecal samples (Pool, black circles) was determined by sequencing the V4 region of the 16S rRNA gene from samples collected daily over 21 days in culture. Microbial diversity (Inverse Simpson, a), total number of OTUs (b), and evenness of OTU distribution (Simpson Evenness, c) was calculated from OTUs (≥97 % average nucleotide identity (ANI)) that were randomly subsampled to 10,000 sequences over 100 iterations. The mean value for the replicate reactors as a function of time in culture is plotted (day 0 = fecal inoculum; error bars represent standard deviation of the mean)
Fig. 2
Fig. 2
Impact of MBRA cultivation on community composition and structure. Using the data described in Figure 1, we determined pairwise relationships between samples from MBRA communities inoculated with different fecal samples and their respective fecal inocula using (a) Bray-Curtis and (b) Sorenson dissimilarity measures and plotted this data with non-metric multi-dimensional scaling. Fecal samples = solid diamonds; MBRA communities = open symbols, with replicate 1 = squares, replicate 2 = circles, replicate 3 = triangles, replicate 4 = diamond, replicate 5 = inverted triangle, replicate 6 = asterisks; donors A, B, C, and the pool = blue, green, purple, and black, respectively. The stress for each NMDS plot is indicated
Fig. 3
Fig. 3
Stabilization of MBRA microbial communities (a). MBRA community stability was assessed by plotting the average Bray-Curtis (BC) similarity between each daily bioreactor sample and other days in culture as a function of time in culture. The point at which reactors reached stability was defined as the inflection point of the curve and varied from day 8–12 (median = day 8). b The mean Bray-Curtis similarity (± standard deviation) for samples at increasing time intervals were calculated for all reactors over the indicated time intervals (days 2–7 (transitioning communities) and days 8–13 (stable communities)) and plotted as a function of days between samples. Statistical testing of each time interval with an unpaired student’s t test demonstrated that the differences in similarity observed between transitioning (days 2–7) and stable (days 8–13) were significant (p ≤ 0.03)
Fig. 4
Fig. 4
Structure of MBRA core microbial communities. We designated those OTUs that were present in ≥90 % of daily samples over days 8–21 within each single reactor over time as members of the “individual core.” Individual Core OTUs that were shared across replicates of the same fecal type were designated members of the “fecal type core” and those present in the core of all MBRA communities were designated “all MBRA core.” We calculated the mean percent abundance of OTUs (a) and sequences (b) in each type of core from reactors on days 8–21 and plotted these values for each replicate (1–3 for donors A, B, or C; 1–6 for pooled fecal donor). Each core type includes those members also present in the broader core type (i.e., individual core = individual core + fecal type core + all MBRA core; fecal type core = fecal type core + all MBRA core)
Fig. 5
Fig. 5
Composition of MBRA core communities and comparison with fecal inocula. We analyzed the phylogenetic distribution of OTUs in the individual core communities and compared this with the phylogenetic distribution of the original fecal inocula. To provide better representation of the fecal inocula, those OTUs absent from the individual core communities that contributed at least 0.5 % of sequences to a fecal sample were also included in our analyses. As in Fig. 4, data present is the mean abundance for each OTU across days 8–21. Following determination of consensus classifications for each OTU (as described in Methods), we plotted the percent abundance of sequences in each phylum (a), genus within Bacteroidetes (b), family within Firmicutes (c), and genus within Proteobacteria (d). If a consensus classification for the phylogenetic level plotted could not be determined with confidence, the next highest classification assigned with ≥80 % is given preceded by the designation “unclassified.” To simplify presentation of abundances in c, several families with low abundance across all samples were condensed in to the designation “other Firmicutes”, which includes Clostridiales Incertae Sedis XIII, Eubacteriaceae, Incertae Sedis XI, unclassified Firmicutes, unclassified Clostridia, unclassified Clostridiales, and Veillonellaceae
Fig. 6
Fig. 6
Analysis of abundance of core OTUs identified in Donor A MBRA communities as a function of time in culture. We determined the abundance of the 94 OTUs that were identified as present in individual core communities for MBRAs inoculated with fecal donor A or were abundant in the donor A fecal sample as described in Fig. 5 and plotted the abundance of these OTUs in the fecal sample and over time in culture (days 1–21) across the three replicate reactors. Data are organized by phylum, with the lowest taxonomic classification assigned with confidence listed on the left hand side. Magnitude of shading is indicated on the figure and ranges from 1 to ≥256 sequences for Firmicutes, Bacteroidetes, and Proteobacteria. Abundance of Actinobacteria sequences range from 1 to 4 sequences; whereas the abundance of the single Verrucomicrobia OTU range from 1 to ≥1024 sequences. The line at the left end of the x-axis indicates the fecal sample. The triangles demarcate time in cultures for the different replicate reactors, with the first time point present on the left side for each replicate. Similar heat maps for donor B and donor C are available in Additional files 8 and 9

References

    1. Blumberg R, Powrie F. Microbiota, disease, and back to health: a metastable journey. Sci Transl Med. 2012;4:137rv7. doi: 10.1126/scitranslmed.3004184. - DOI - PMC - PubMed
    1. Hooper LV, Littman DR, Macpherson AJ. Interactions between the microbiota and the immune system. Science. 2012;336:1268–73. doi: 10.1126/science.1223490. - DOI - PMC - PubMed
    1. Nicholson JK, Holmes E, Kinross J, Burcelin R, Gibson G, Jia W, et al. Host-gut microbiota metabolic interactions. Science. 2012;336:1262–7. doi: 10.1126/science.1223813. - DOI - PubMed
    1. Ursell LK, Treuren WV, Metcalf JL, Pirrung M, Gewirtz A, Knight R. Replenishing our defensive microbes. BioEssays. 2013;35:810–7. doi: 10.1002/bies.201300018. - DOI - PMC - PubMed
    1. Pflughoeft KJ, Versalovic J. Human microbiome in health and disease. Annu Rev Pathol Mech Dis. 2012;7:99–122. doi: 10.1146/annurev-pathol-011811-132421. - DOI - PubMed

Publication types