. 2015 Sep 30:3:61.
doi: 10.1186/s40478-015-0239-6.

Heterogeneity of aquaporin-4 localization and expression after focal cerebral ischemia underlies differences in white versus grey matter swelling

Affiliations

Heterogeneity of aquaporin-4 localization and expression after focal cerebral ischemia underlies differences in white versus grey matter swelling

Jesse A Stokum et al. Acta Neuropathol Commun. .

Abstract

Introduction: Ischemic stroke, a major cause of mortality, is frequently accompanied by life-threatening cerebral edema. Aquaporin-4 (Aqp4), an astrocytic transmembrane water channel, is an important molecular contributor to cerebral edema formation. Past studies of Aqp4 expression and localization after ischemia examined grey matter exclusively. However, as white matter astrocytes differ developmentally, physiologically, and molecularly from grey matter astrocytes, we hypothesized that functionally important regional heterogeneity exists in Aqp4 expression and subcellular localization following cerebral ischemia.

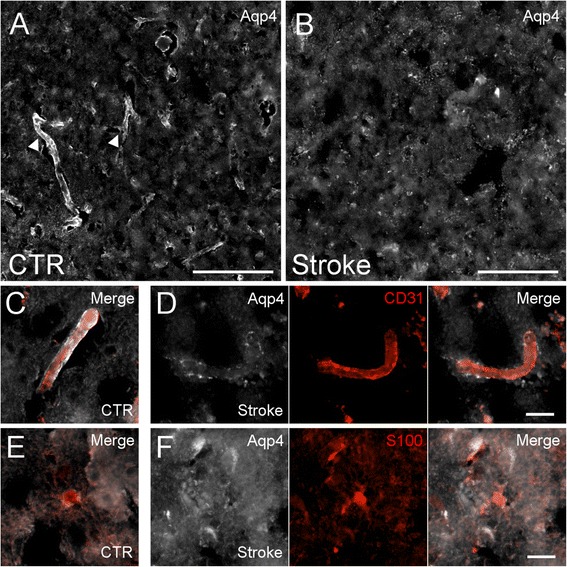
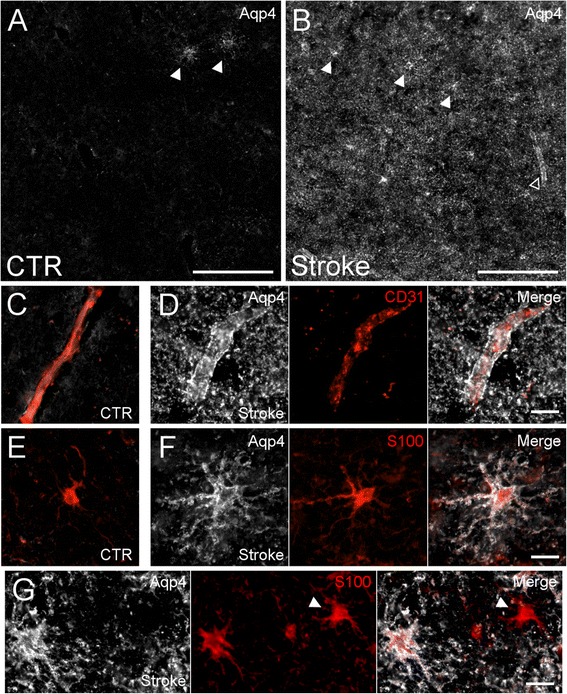
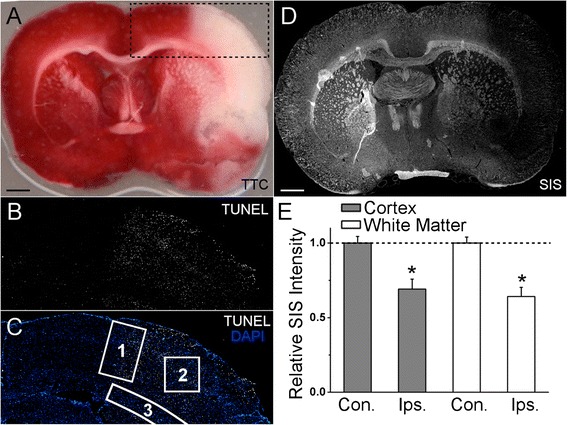
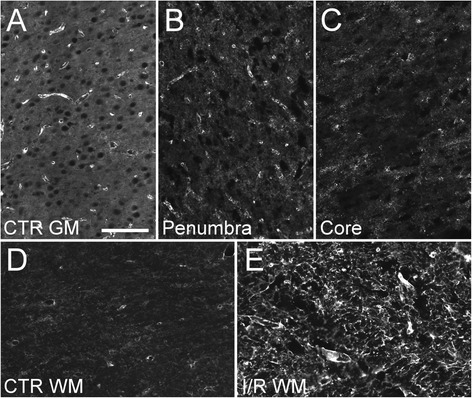
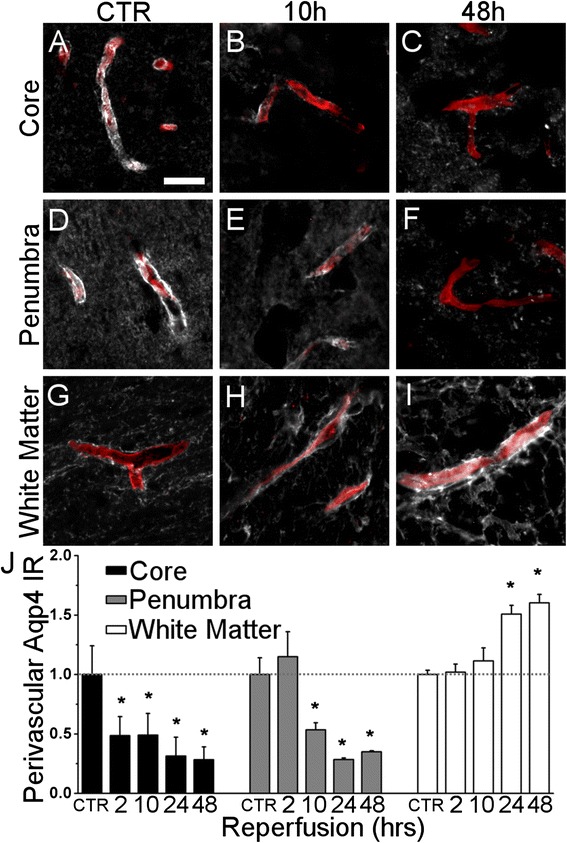
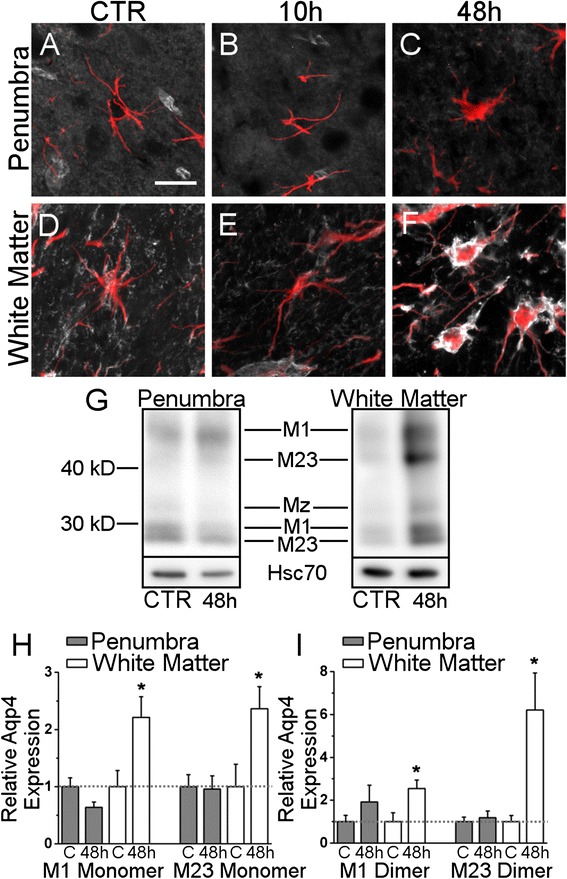
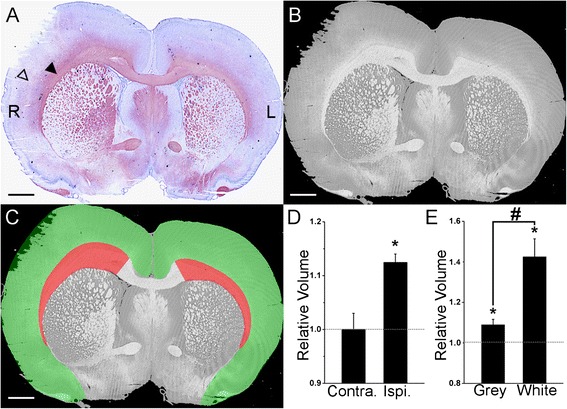
Results: Subcellular localization of Aqp4 was compared between cortical and white matter astrocytes in postmortem specimens of patients with focal ischemic stroke versus controls. Subcellular localization and expression of Aqp4 was examined in rats subjected to experimental stroke. Volumetric analysis was performed on the cortex and white matter of rats subjected to experimental stroke. Following cerebral ischemia, cortical astrocytes exhibited reduced perivascular Aqp4 and unchanged Aqp4 protein abundance. In contrast, white matter astrocytes exhibited increased perivascular and plasmalemmal Aqp4 and a 2.2- to 6.2-fold increase in Aqp4 isoform abundance. Ischemic white matter swelled by approximately 40 %, while cortex swelled by approximately 9 %.

Conclusions: The findings reported here raise the possibility that cerebral white matter may play a heretofore underappreciated role in the formation of cerebral edema following ischemia.


Figures

Fig. 1
Fig. 1
Aqp4 in ischemic human cortex. a, b montages of micrographs of tissue from control (CTR) human cortex (a) or ischemic human cortex from patients with ischemic stroke (b) immunolabeled for Aqp4 (white), showing perivascular Aqp4 in the control human cortex (filled arrowheads) and loss of perivascular Aqp4 in the ischemic cortex; scale bars 200 μm. c-f micrographs of control cortical tissue (c, e) or ischemic cortex (d, f) immunolabeled for Aqp4 (white) and co-labeled for CD31 (red) (c, d) or S100 (red) (e, f), showing attenuation of perivascular Aqp4 in the ischemic cortex (d), with no increased Aqp4 in the somata or processes of astrocytes in the ischemic cortex (f); micrographs in C and E depict merged fluorescent channels for Aqp4 and either CD31 or S100; micrographs in D and F individually depict the Aqp4 channel, the CD31 or S100 channel, and the merged fluorescent image; scale bars 20 μm
Fig. 2
Fig. 2
Aqp4 in ischemic human subcortical white matter. a, b montages of micrographs of tissue from control (CTR) human subcortical white matter (a) or ischemic human subcortical white matter from patients with ischemic stroke (b) immunolabeled for Aqp4 (white), showing minimal Aqp4 expression in control tissue with scarce Aqp4 positive cells (filled arrowheads) and increased Aqp4 immunoreactivity in ischemic white matter in ramified cells (filled arrowheads) and surrounding vessels (empty arrowhead); scale bars 200 μm. (c-g) micrographs of control white matter (c, e) or ischemic white matter (d, f, g) immunolabeled for Aqp4 (white) and co-labeled for CD31 (red) (c, d) or S100 (red) (e, f, g) showing increased perivascular Aqp4 in the ischemic white matter (d), increased Aqp4 in the somata and processes of white matter astrocytes in the ischemic white matter (f), and rare Aqp4 negative astrocytes in the ischemic white matter (filled arrowhead) (g); micrographs in C and E depict the merged fluorescent channels for Aqp4 and either CD31 or S100; micrographs in D, F, and G individually depict the Aqp4 channel, the CD31 or S100 channel, and the merged fluorescent image; scale bars 20 μm
Fig. 3
Fig. 3
A rat model of ischemic stroke. a image of triphenyl tetrazolium chloride (TTC) stained rat brain coronal section, taken through the MCA territory after 2 hour ischemia MCAO with 24 hours of reperfusion showing the extent of the ischemic lesion; scale bar 1 mm. b montage of micrographs of rat brain tissue after 2 hour ischemia MCAO and 24 hours of reperfusion processed for terminal deoxynucleotidyl transferase dUTP nick end labeling (TUNEL) (white) showing the spread of cell death that ends at penumbral tissue located at the ACA-MCA watershed region; field of view corresponds to the dashed region in A. c montage of micrographs shown in B merged with DAPI channel (blue) showing the location of the cortical penumbra ROI (ROI 1), the ischemic core ROI (ROI 2), and the subcortical white matter ROI (ROI 3) used for analysis of immunohistochemistry; field of view corresponds to the dashed region in A. d montage of micrographs of a coronal section after 2 hour ischemia MCAO and 24 hours of reperfusion processed for silver infarct staining (SIS) showing reduced staining in the ischemic grey matter and ischemic white matter; scale bar 1 mm. e visualization of analysis of silver infarct staining in cortex and white matter; Con. = contralateral hemisphere; Ips. = ipsilateral hemisphere; n = 3 rats per group; * p < 0.05 in comparison to the contralateral baseline, depicted as dotted horizontal line
Fig. 4
Fig. 4
Aqp4 subcellular distribution after MCAO. a-e montages of micrographs of rat brain tissue immunolabeled for Aqp4 (white) in the control (CTR) cortical grey matter (GM) (a), the cortical penumbra after 2 hour ischemia and 24 hours reperfusion (b), the cortical infarct core after 2 hour ischemia and 24 hours reperfusion (c), the control subcortical white matter (WM), including the lateral corpus callosum and external capsule (d), or the ipsilateral subcortical white matter 2 hours ischemia and 48 hours reperfusion (I/R) (e) showing decreased perivascular Aqp4 in the cortical penumbra and cortical infarct but increased Aqp4 in the subcortical white matter after ischemia; scale bar 100 μm
Fig. 5
Fig. 5
Perivascular Aqp4 after MCAO. a-i micrographs of rat brain tissue immunolabeled for Aqp4 (white) and co-labeled for RECA-1 (red) in the control (CTR) cortex (a, d), the control subcortical white matter (g), the cortical infarct core at 10 and 48 hours reperfusion (b, c), the cortical penumbra at 10 and 48 hours reperfusion (e, f), or the subcortical white matter ipsilateral to MCAO at 10 and 48 hours reperfusion (h, i) showing loss of perivascular Aqp4 in the cortical infarct core by 10 hours reperfusion, attenuated perivascular Aqp4 in the cortical penumbra by 10 hours reperfusion, and increased perivascular Aqp4 in the subcortical white matter by 48 hours reperfusion. j visualization of temporal analysis of perivascular Aqp4 in experimental ROIs; IR = immunoreactivity; abscissa denotes control animals (CTR) and reperfusion-time after 2 hour ischemia; n = 4 rats per group; * p < 0.05 in comparison to the control baseline, depicted as dotted horizontal line
Fig. 6
Fig. 6
Soma plasmalemma Aqp4 and Aqp4 abundance after MCAO. a-f micrographs of rat brain tissue immunolabeled for Aqp4 (white) and co-labeled for GFAP (red) in the control (CTR) cortex (a), the control subcortical white matter (d), the cortical penumbra at 10 and 48 hours reperfusion (b, c), or the subcortical white matter ipsilateral to MCAO at 10 and 48 hours reperfusion (e, f) showing low Aqp4 immunoreactivity at the astrocyte soma plasmalemma in the cortical penumbra at 48 hours reperfusion and increased Aqp4 at the astrocyte soma plasmalemma in the subcortical white matter at 48 hours reperfusion. g Aqp4 immunoblot of control tissue and cortical penumbra and subcortical white matter following 2 hour ischemia and 48 hours of reperfusion; 48 h = tissue obtained from rats submitted to 120 minute MCAO and 48 hours of reperfusion. h, i) visualization of quantification of immunoblot in G for Aqp4 monomer isoforms (h) and Aqp4 dimer isoforms (i); the ordinate reflects Aqp4 isoform band optical density normalized to Hsc-70 band optical density and then normalized to control tissue baseline; C = control tissue; n = 4 rats per group; * p < 0.05 comparison to the control baseline, depicted as dotted horizontal line
Fig. 7
Fig. 7
Regional swelling after MCAO. a image of a coronal slice of brain tissue from a rat submitted to 4.5 hour ischemia and 24 hours of reperfusion, stained with the myelin stain Black Gold II and counterstained with cresyl violet, demonstrating the raw image data prior to volumetric analysis; lateral corpus callosum (filled arrowhead), cortex (empty arrowhead). b hue channel obtained from red-green-blue to hue-saturation-intensity transformation of A, demonstrating the input image to the algorithm used for automated segmentation of subcortical white matter. c image of output from active contour segmentation of B showing ipsilateral and contralateral cortex segmentations (green) and subcortical white matter segmentations (red) overlaid with the input hue image in B. d visualization of quantification of hemispheric swelling; the ordinate reflects the combination of the ipsilateral (Ipsi.) or contralateral (Contra.) segmentations normalized to the combination of the contralateral segmentations; n = 5 rats per group; * p < 0.05 comparison to the contralateral baseline, depicted as dotted horizontal line. e visualization of quantification of swelling of cortex (Grey) and subcortical white matter (White); the ordinate reflects the volume of either the ipsilateral cortical grey matter or ipsilateral subcortical white matter normalized to the volume of the contralateral cortex or subcortical white matter; n = 5 rats per group; * p < 0.05 comparison to the contralateral baseline, depicted as dotted horizontal line; # p < 0.05 comparison between cortical grey matter versus subcortical white matter

References

    1. Lozano R, Naghavi M, Foreman K, Lim S, Shibuya K, Aboyans V, et al. Global and regional mortality from 235 causes of death for 20 age groups in 1990 and 2010: a systematic analysis for the Global Burden of Disease Study 2010. Lancet. 2012;380:2095–128. doi: 10.1016/S0140-6736(12)61728-0. - DOI - PMC - PubMed
    1. Berrouschot J, Sterker M, Bettin S, Koster J, Schneider D. Mortality of space-occupying (‘malignant’) middle cerebral artery infarction under conservative intensive care. Intensive Care Med. 1998;24:620–3. doi: 10.1007/s001340050625. - DOI - PubMed
    1. Shaw CM, Alvord EC, Jr, Berry RG. Swelling of the brain following ischemic infarction with arterial occlusion. Arch Neurol. 1959;1:161–77. doi: 10.1001/archneur.1959.03840020035006. - DOI - PubMed
    1. Frank JI. Large hemispheric infarction, deterioration, and intracranial pressure. Neurology. 1995;45:1286–90. doi: 10.1212/WNL.45.7.1286. - DOI - PubMed
    1. Battey TW, Karki M, Singhal AB, Wu O, Sadaghiani S, Campbell BC, et al. Brain edema predicts outcome after nonlacunar ischemic stroke. Stroke. 2014;45:3643–8. doi: 10.1161/STROKEAHA.114.006884. - DOI - PMC - PubMed

Publication types

MeSH terms