. 2016 Jun;17(5):741-54.
doi: 10.1111/mpp.12326. Epub 2015 Nov 11.

Host specificity in Sporisorium reilianum is determined by distinct mechanisms in maize and sorghum

Affiliations

Host specificity in Sporisorium reilianum is determined by distinct mechanisms in maize and sorghum

Alana Poloni et al. Mol Plant Pathol. 2016 Jun.

Abstract

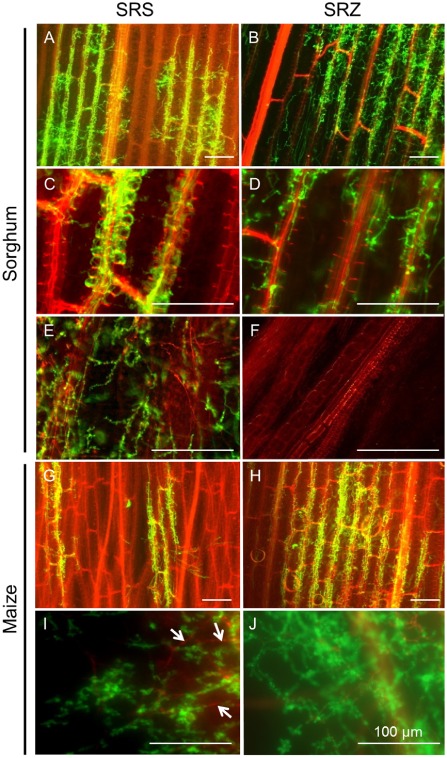
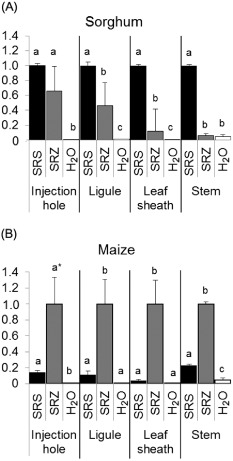
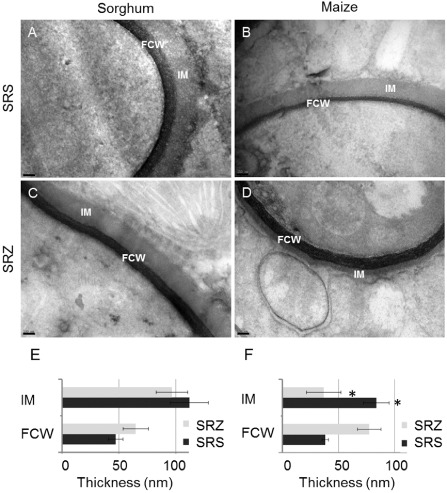
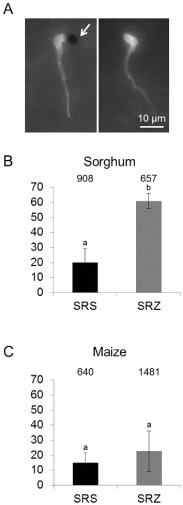
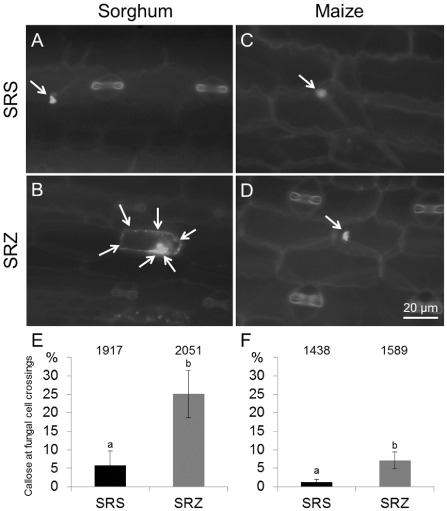
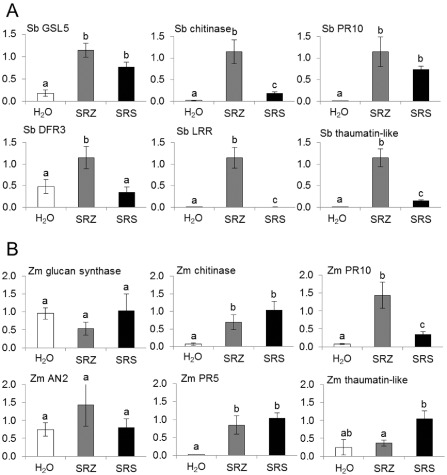
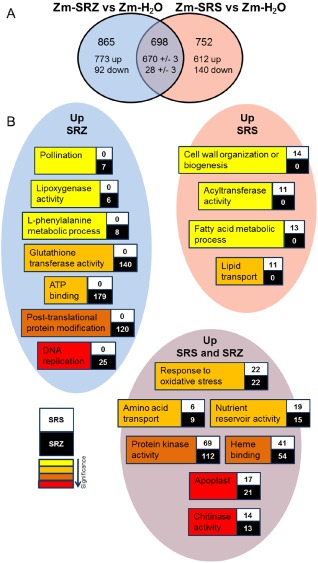
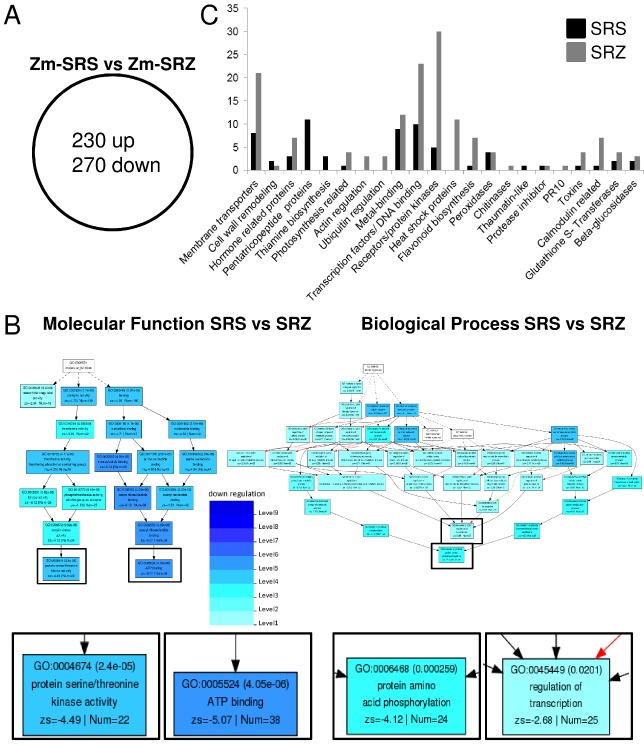
Smut fungi are biotrophic plant pathogens that exhibit a very narrow host range. The smut fungus Sporisorium reilianum exists in two host-adapted formae speciales: S. reilianum f. sp. reilianum (SRS), which causes head smut of sorghum, and S. reilianum f. sp. zeae (SRZ), which induces disease on maize. It is unknown why the two formae speciales cannot form spores on their respective non-favoured hosts. By fungal DNA quantification and fluorescence microscopy of stained plant samples, we followed the colonization behaviour of both SRS and SRZ on sorghum and maize. Both formae speciales were able to penetrate and multiply in the leaves of both hosts. In sorghum, the hyphae of SRS reached the apical meristems, whereas the hyphae of SRZ did not. SRZ strongly induced several defence responses in sorghum, such as the generation of H2 O2 , callose and phytoalexins, whereas the hyphae of SRS did not. In maize, both SRS and SRZ were able to spread through the plant to the apical meristem. Transcriptome analysis of colonized maize leaves revealed more genes induced by SRZ than by SRS, with many of them being involved in defence responses. Amongst the maize genes specifically induced by SRS were 11 pentatricopeptide repeat proteins. Together with the microscopic analysis, these data indicate that SRZ succumbs to plant defence after sorghum penetration, whereas SRS proliferates in a relatively undisturbed manner, but non-efficiently, on maize. This shows that host specificity is determined by distinct mechanisms in sorghum and maize.

Keywords: RNA sequencing; Sporisorium reilianum; defence responses; fluorescence microscopy; host specificity; phytopathogenic fungi; transcriptome.


Figures

Figure 1
Figure 1
Microscopic characterization of sorghum and maize infection by S porisorium reilianum. Sorghum (A–F) and maize (G–J) seedlings were syringe inoculated with S . reilianum f. sp. reilianum (SRS) (left) or S . reilianum f. sp. zeae (SRZ) (right). Samples were collected at 4 days after inoculation (dai) (A, B, G, H), 9 dai (C, D) or 15 dai (E, F, I, J). Plant material and dead hyphae were stained with propidium iodide and appear red; fungal hyphae were stained with wheat germ agglutinin (WGA)‐Alexafluor‐488 and appear green. Sorghum samples inoculated with SRS show hyphae colonizing leaf tissues (A) and presenting a preference for vascular bundles (C), later reaching the nodes and apical meristems (E). SRZ infects leaves (B) and leaf sheaths (D), without showing such a preference for vascular bundles, and without reaching the nodes and apical meristems (F). Maize plants inoculated with SRS show hyphae colonizing leaf tissues (G) and reaching the nodes and apical meristem (I), where some dead hyphae are also observed (white arrows). Leaves inoculated with SRZ show extensive fungal growth (H) and the pathogen reaches the nodes and apical meristem (J). Bars, 100 μm; n = 12 plant samples.
Figure 2
Figure 2
Quantification of fungal biomass in planta by quantitative polymerase chain reaction (qPCR). Fungal DNA was quantified relative to plant DNA and relative to S porisorium reilianum f. sp. reilianum (SRS) DNA (A) or to S . reilianum f. sp. zeae (SRZ) DNA (B). Samples from the inoculation site, ligule, leaf sheath and stems were collected at 9 days after inoculation (dai) from sorghum and maize. (A) In sorghum, a greater amount of DNA from SRS than from SRZ was detected in ligules, leaf sheaths and stems. (B) In maize, SRZ was dominant in ligules, leaf sheaths and stems. The presence of SRS was observed in maize stems, whereas SRZ could not be detected in sorghum stems. The experiment was performed in three biological replicates of 10 plants each that were inoculated with SRS, SRZ or water. Error bars represent the standard error of the mean (SEM). Different letters above the bars indicate a significant difference (t‐test with P ≤ 0.05) within one tissue. *P value comparing the data of SRS and SRZ at the injection hole is slightly above 0.05.
Figure 3
Figure 3
Electron micrographs of sections obtained from sorghum (A, C) and maize (B, D) infected with S porisorium reilianum f. sp. reilianum (SRS) (A, B) or S . reilianum f. sp. zeae (SRZ) (C, D). Photographs show transverse cuts of fungal hyphae with black fungal cell wall (FCW) and grey interfacial matrix (IM). Measurements were performed for FCW and IM in sorghum (E, n = 10) and maize (F, n = 8). Error bars give the standard error of the mean (SEM); size bars, 100 nm.
Figure 4
Figure 4
H2O2 accumulation at S porisorium reilianum infection sites in maize and sorghum. Samples were collected at 1 day after inoculation (dai) and were stained with 3,3′‐diaminobenzidine (DAB) and calcofluor. (A) Examples of appressoria showing H2O2 deposition (left, white arrow) and without H2O2 (right). (B, C) Percentage of appressoria with H2O2 deposition for sorghum (B) and maize (C). Three biological replicates containing three to four plants each were analysed. Data given are the mean values and standard deviations. The total number of counted appressoria is indicated above the bars. Different letters above the columns indicate significant differences (t‐test with P ≤ 0.05).
Figure 5
Figure 5
Callose deposition in infected sorghum and maize. Sorghum (A, B, E) and maize (C, D, F) leaves were collected at 2 days after inoculation (dai). Sorghum infected with S porisorium reilianum f. sp. reilianum (SRS) showed weak and localized callose deposition (A, E), whereas stronger and more frequent levels of callose were observed for S . reilianum f. sp. zeae (SRZ) (B, E). In maize, callose was observed in small and localized amounts for SRS (C) and SRZ (D), and was slightly more frequent for SRZ (F). (E) and (F) show the percentage of occurrence of callose at hyphal cell‐to‐cell crossings in sorghum and maize, respectively. Hyphal cell‐to‐cell crossings were counted for three biological replicates consisting of two leaves of two plants each. Data given are the mean values and standard deviations. The total number of counted cell‐to‐cell crossings is given above the bars. Different letters above the columns indicate significant differences (t‐test with P ≤ 0.05).
Figure 6
Figure 6
Quantification of defence gene expression in sorghum and maize inoculated with S porisorium reilianum f. sp. reilianum (SRS) (black), S . reilianum f. sp. zeae (SRZ) (grey) or water (H2O, white). Changes in transcript levels of marker genes of sorghum (Sb) are shown in (A), whereas maize (Zm) genes are shown in (B). Mean values and standard deviations of three biological replicates containing eight plants each are shown. Different letters above the columns show significant differences (t‐test with P ≤ 0.05). AN2, involved in kauralexin biosynthesis; DFR3, dihydroflavonol 4‐reductase; GSL5, glucan synthase‐like 5; LRR, leucine‐rich repeat; PR5, pathogenesis‐related protein 5; PR10, pathogenesis‐related protein 10.
Figure 7
Figure 7
Comparison of transcriptome analysis of maize leaves infected with S porisorium reilianum f. sp. reilianum (SRS) and S . reilianum f. sp. zeae (SRZ) vs. water control samples. (A) Venn diagram showing the distribution of genes differentially regulated (P ≤ 0.05) in the comparison of SRS‐infected samples vs. water‐inoculated control samples (ZmSRS vs. ZmH2O) and SRZ‐infected samples vs. water‐inoculated control samples (ZmSRZ vs. ZmH2O). (B) Examples of gene ontology (GO) terms up‐regulated by SRS, SRZ or both fungi when compared with water‐inoculated control samples. Boxes contain the number of genes induced by SRS (white box) or by SRZ (black box) belonging to each associated GO term. Background colours of the GO terms indicate significance according to the key.
Figure 8
Figure 8
Comparison of transcriptome analysis of maize leaves infected with S porisorium reilianum f. sp. reilianum (SRS) relative to S . reilianum f. sp. zeae (SRZ)‐infected samples. (A) Venn diagram showing the distribution of genes differentially regulated (P ≤ 0.05) in the comparison of SRS‐ with SRZ‐infected samples (ZmSRS vs. ZmSRZ). (B) Pathway mapping of the significantly enriched gene ontology (GO) terms in the comparison of ZmSRS vs. ZmSRZ showing the categories ‘Molecular function’ and ‘Biological process’. Four culminating GO terms are enlarged below for better readability. Boxes with GO terms have the GO ID, the false discovery rate (FDR), the GO term, the z score and the number of submitted maize genes belonging to the respective GO term. Background colours of GO terms indicate significance according to the key. (C) Summary of gene identity of differentially up‐regulated annotated genes of (A) in samples infected with SRS (black) and SRZ (grey). The graph shows the annotation and number of genes belonging to each function (212 genes are represented; complete gene lists are available in Tables S2 and S3, see Supporting Information).

References

    1. Ahuja, I. , Kissen, R. and Bones, A.M. (2012) Phytoalexins in defense against pathogens. Trends Plant Sci. 17, 73–90. - PubMed
    1. Akagi, Y. , Akamatsu, H. , Otani, H. and Kodama, M. (2009) Horizontal chromosome transfer, a mechanism for the evolution and differentiation of a plant‐pathogenic fungus. Eukaryot. Cell, 8, 1732–1738. - PMC - PubMed
    1. Altschul, S.F. , Gish, W. , Miller, W. , Myers, E.W. and Lipman, D.J. (1990) Basic local alignment search tool. J. Mol. Biol. 215, 403–410. - PubMed
    1. Bhuiyan, N.H. , Selvaraj, G. , Wei, Y. and King, J. (2009) Role of lignification in plant defense. Plant Signal. Behav. 4, 158–159. - PMC - PubMed
    1. De Jonge, R. , van Esse, H.P. , Kombrink, A. , Shinya, T. , Desaki, Y. , Bours, R. , van der Krol, S. , Shibuya, N. , Joosten, M.H.A.J. and Thomma, B.P.H.J. (2010) Conserved fungal LysM effector Ecp6 prevents chitin‐triggered immunity in plants. Science, 329, 953–955. - PubMed

Publication types

MeSH terms

Substances

LinkOut - more resources