. 2015 Sep 30:16:211.
doi: 10.1186/s13059-015-0763-5.

Postnatal epigenetic regulation of intestinal stem cells requires DNA methylation and is guided by the microbiome

Affiliations

Postnatal epigenetic regulation of intestinal stem cells requires DNA methylation and is guided by the microbiome

Da-Hai Yu et al. Genome Biol. .

Abstract

Background: DNA methylation is an epigenetic mechanism central to development and maintenance of complex mammalian tissues, but our understanding of its role in intestinal development is limited.

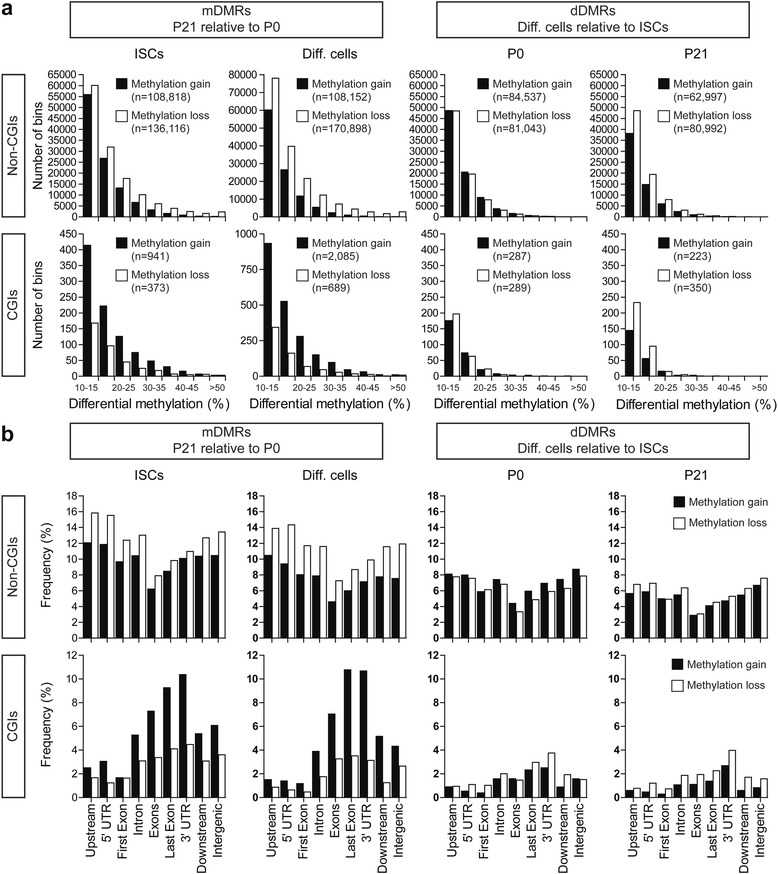
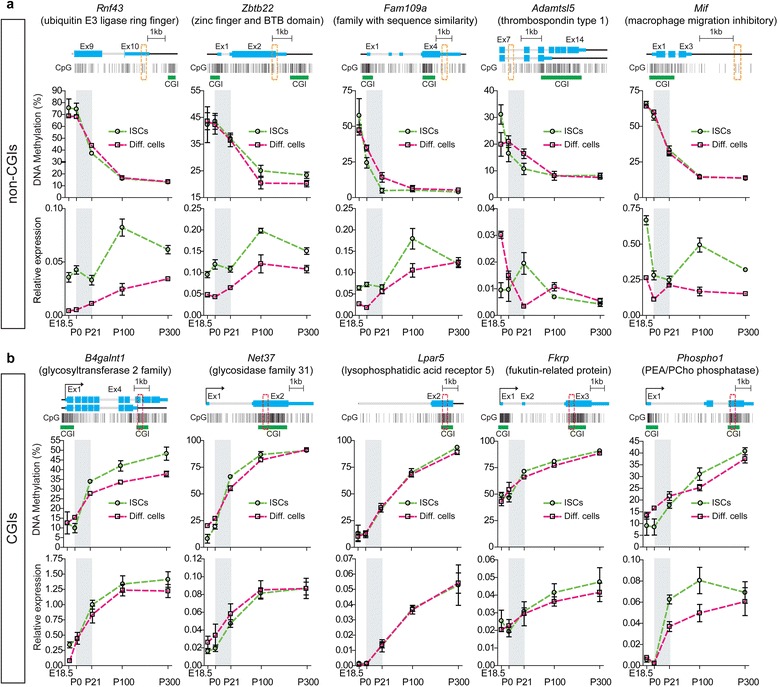
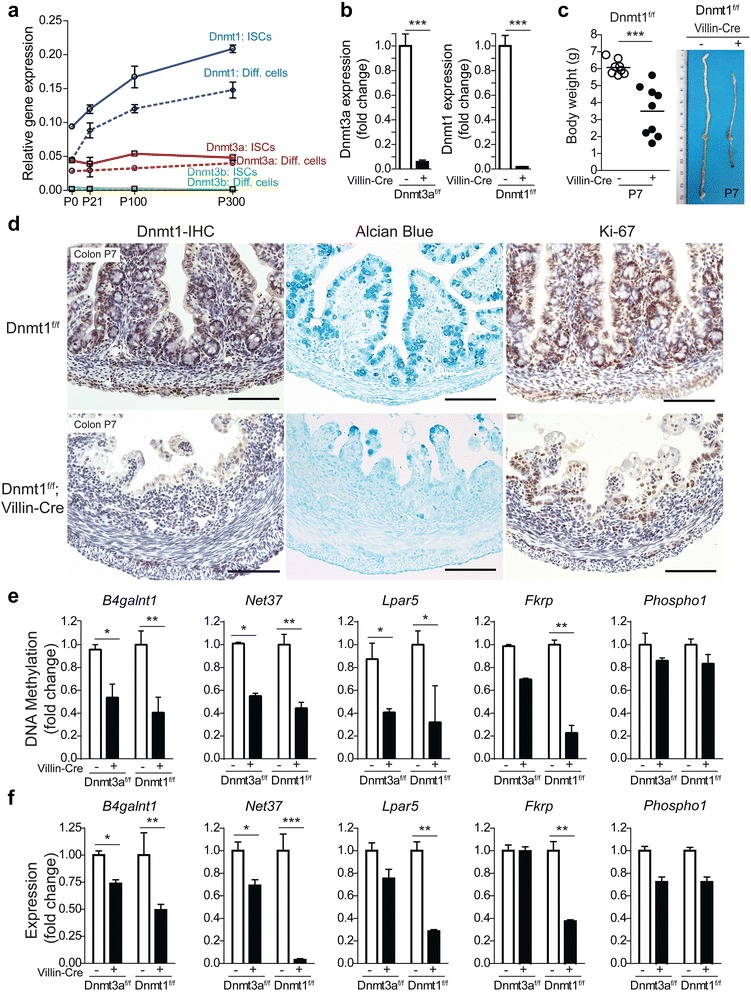
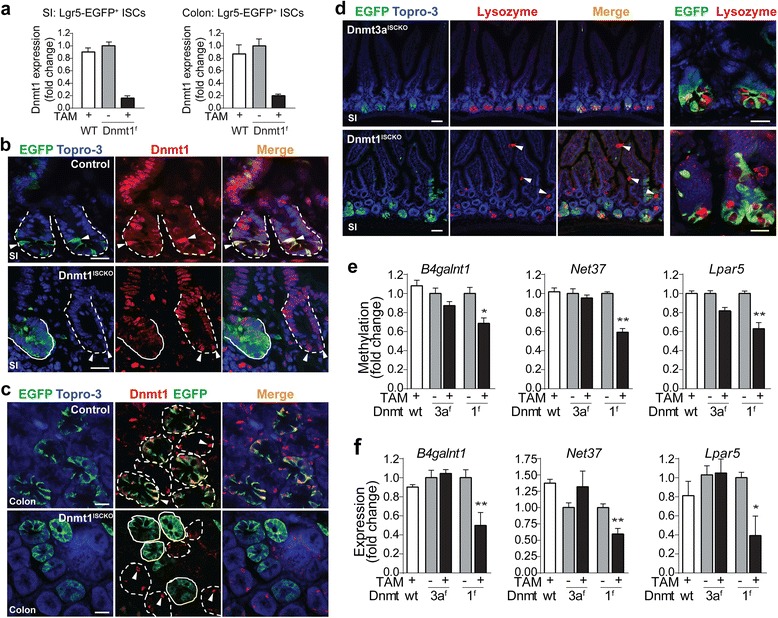
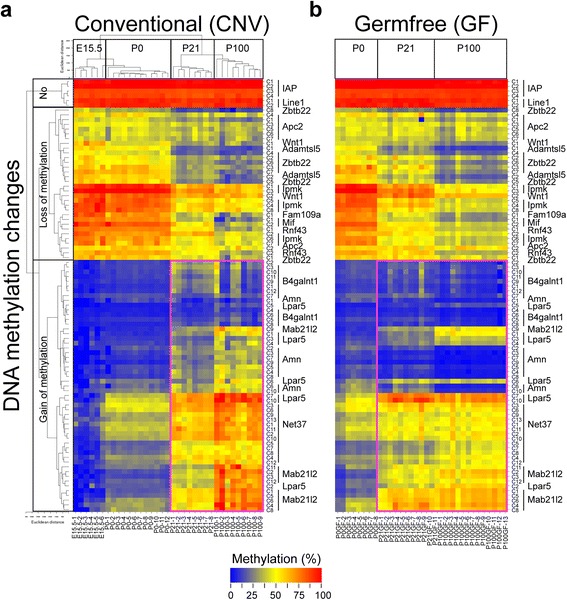
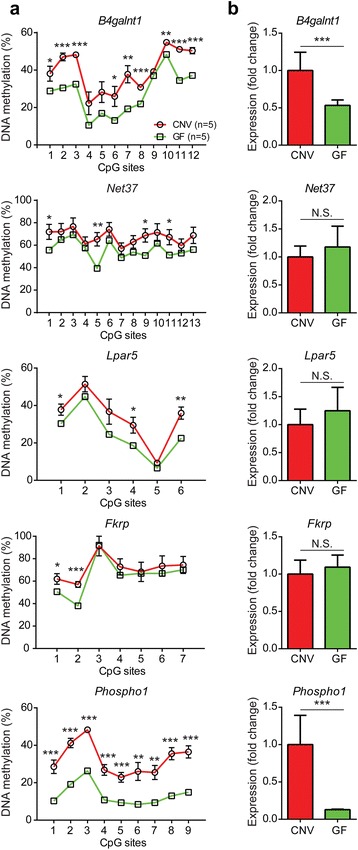
Results: We use whole genome bisulfite sequencing, and find that differentiation of mouse colonic intestinal stem cells to intestinal epithelium is not associated with major changes in DNA methylation. However, we detect extensive dynamic epigenetic changes in intestinal stem cells and their progeny during the suckling period, suggesting postnatal epigenetic development in this stem cell population. We find that postnatal DNA methylation increases at 3' CpG islands (CGIs) correlate with transcriptional activation of glycosylation genes responsible for intestinal maturation. To directly test whether 3' CGI methylation regulates transcription, we conditionally disrupted two major DNA methyltransferases, Dnmt1 or Dnmt3a, in fetal and adult intestine. Deficiency of Dnmt1 causes severe intestinal abnormalities in neonates and disrupts crypt homeostasis in adults, whereas Dnmt3a loss was compatible with intestinal development. These studies reveal that 3' CGI methylation is functionally involved in the regulation of transcriptional activation in vivo, and that Dnmt1 is a critical regulator of postnatal epigenetic changes in intestinal stem cells. Finally, we show that postnatal 3' CGI methylation and associated gene activation in intestinal epithelial cells are significantly altered by germ-free conditions.

Conclusions: Our results demonstrate that the suckling period is critical for epigenetic development of intestinal stem cells, with potential important implications for lifelong gut health, and that the gut microbiome guides and/or facilitates these postnatal epigenetic processes.


Figures

Fig. 1
Fig. 1
Unbiased analysis of DNA methylomes in colonic ISCs and their progeny during the suckling period. a Numbers of DMRs identified from the comparisons between either developmental stages (mDMRs, left) or differentiation states (dDMRs, right). Analyses were based on the association of DMRs with non-CGIs (top), and with CGIs (bottom). Black bars indicate methylation gains and white bars indicate methylation losses. b Distribution of mDMRs or dDMRs relative to gene region categories based on RefSeq annotation of all known genes. CGI-associated mDMRs are enriched in the gene body and 3′ end
Fig. 2
Fig. 2
Temporal analysis of both DNA methylation and gene expression at identified candidate genes. a Non-CGI mDMR genes undergoing developmental loss of methylation. b 3′ CGI mDMR genes undergoing developmental gain of methylation. The suckling period is highlighted in gray. For each gene, exon–intron structure (including isoforms) and CpG map are shown on the top. Thin blue bars represent the 5′ or 3′ UTRs and thick blue boxes represent coding exons. Each vertical line represents a CpG site and green bars indicate CGIs. Red dotted boxes indicate the regions analyzed for CpG methylation. The gene expression is relative to β-actin. Error bars represent standard error of the mean of three to five biological replicates
Fig. 3
Fig. 3
Deletion of Dnmt3a or Dnmt1 in developing intestine. a mRNA expression analysis of three Dnmts in Lgr5+ ISCs and differentiated epithelial cells at various postnatal ages. b mRNA expression analysis confirms efficient epithelial cell specific ablation of Dnmt3a (left, by 90 %) or Dnmt1 (right, by 95 %) in homozygous mutant mice. c Villin-Cre mediated Dnmt1 deletion caused significant reductions in body weight (left) and intestinal length (right) at P7. d Immuno-histochemical staining for Dnmt1, Alcian blue and Ki-67 showed blunted villi, reduced goblet cells, and decreased proliferative cells in the colons of Dnmt1 f/f ; Villin-Cre mice. Scale bars, 100 μm. DNA methylation (e) and gene expression (f) analysis of 3′ CGI-associated genes in the colonic intestinal epithelium collected from Dnmt3a and Dnmt1 homozygous mutant mice at P7, compared with control littermates. Error bars represent standard error of the mean of at least three replicate experiments. *P < 0.05, **P < 0.01, and ***P < 0.001 versus control (two-sided t test)
Fig. 4
Fig. 4
Deletion of Dnmt1 in adult ISCs alters crypt homeostasis and postnatal epigenetic regulation. a mRNA expression analysis confirms decreased expression of Dnmt1 in Lgr5-EGFP+ ISCs isolated from Dnmt1 ISCKO mice, in both small intestine (SI) and colon. TAM tamoxifen, WT wild type. b Immunofluorescent analysis of ISCs (EGFP, green), Dnmt1 (red), and nuclei (Topro-3, blue) in small intestine crypts. In tamoxifen-treated control (Dnmt-wild type; Lgr5-EGFP-CreER) mice (top panel), dotted lines mark crypts, and ISCs (green) show strong Dnmt1 staining (indicated by white arrowheads). In Dnmt1 ISCKO mice (bottom panel), the Lgr5-EGFP+ mutant crypt (outlined by solid line) shows decreased Dnmt1 staining and aggregation of CBCs, whereas an adjacent EGFP-negative crypt (outlined by dashed line) contains CBCs with wild-type Dnmt1 and high expression of Dnmt1 (white arrowheads). Scale bars, 20 μm. c Immunofluorescent analysis of ISCs and Dnmt1 in control (top panel) and Dnmt1 ISCKO (bottom panel) colons. Similar mosaic patterns of Dnmt1 deletion are observed in colon. Scale bars, 20 μm. d Immunofluorescent analysis of Paneth cells in Dnmt3a ISCKO and Dnmt1 ISCKO mice. Paneth cells staining positive for lysozyme (red) are exclusively located at crypt bottoms in Dnmt3a ISCKO mice (top panel), whereas lysozyme+ cells (arrowheads) were detected at villus epithelia in Dnmt1 ISCKO mice (bottom panel). Scale bars, 50 μm. Far right panels show a magnified view of Lgr5-EGFP+ ISCs for each genotype; the clear segregation between CBCs and Paneth cells is lost in the Dnmt1 ISCKO mice. DNA methylation (e) and gene expression (f) analysis of 3′ CGI-associated genes in the colonic Lgr5+ ISCs collected from wild-type (wt) control, Dnmt3a f/f; Lgr5-EGFP-CreER and Dnmt1 f/f; Lgr5-EGFP-CreER mice, with or without tamoxifen (TAM) administration. Error bars represent standard error of the mean of at least three replicate experiments. *P < 0.05, **P < 0.01, and ***P < 0.001 versus control (two-sided t test)
Fig. 5
Fig. 5
The germ-free condition affects developmentally programmed CGI methylation. a Unsupervised hierarchical clustering analysis on the basis of DNA methylation profiling in mouse colon under conventional (CNV) conditions. Each row indicates a CpG site and the corresponding gene name is indicated on the right. Each column indicates a sample analyzed and the corresponding age is indicated on the bottom. Methylation levels range from unmethylated (blue) to fully methylated (red), as indicated by the color legend at the bottom of the graphs. b DNA methylation profiling in mouse colon under germ-free (GF) conditions. The orders for CpG sites and age groups are pre-defined based on the conventional samples. Purple boxes highlight 3′ CGI-associated CpGs at which the methylation levels are significantly altered by germ-free conditions
Fig. 6
Fig. 6
The germ-free condition affects developmentally programmed 3′ CGI methylation and transcription in intestinal epithelial cells. a DNA methylation status at multiple CpG sites of five 3′ CGI-associated genes are compared between two conditions: CNV (N = 5, red) and GF (N = 5, green). The error bars represent standard error of the mean. The error bars for the GF group are not showing as they are smaller than the symbols. b Gene expression analysis of corresponding 3′ CGI genes. *P < 0.05, **P < 0.01 and ***P < 0.001, N.S. not significant

References

    1. Cheng H, Bjerknes M. Whole population cell kinetics and postnatal development of the mouse intestinal epithelium. Anat Rec. 1985;211:420–6. doi: 10.1002/ar.1092110408. - DOI - PubMed
    1. Cheng H, Leblond CP. Origin, differentiation and renewal of the four main epithelial cell types in the mouse small intestine. V. Unitarian Theory of the origin of the four epithelial cell types. Am J Anat. 1974;141:537–61. doi: 10.1002/aja.1001410407. - DOI - PubMed
    1. Henning SJ. Postnatal development: coordination of feeding, digestion, and metabolism. Am J Physiol. 1981;241:G199–214. - PubMed
    1. Barker N, van Es JH, Kuipers J, Kujala P, van den Born M, Cozijnsen M, et al. Identification of stem cells in small intestine and colon by marker gene Lgr5. Nature. 2007;449:1003–7. doi: 10.1038/nature06196. - DOI - PubMed
    1. Sheaffer KL, Kaestner KH. Transcriptional networks in liver and intestinal development. Cold Spring Harb Perspect Biol. 2012;4:a008284. doi: 10.1101/cshperspect.a008284. - DOI - PMC - PubMed

Publication types

Substances