. 2015 Oct 13;112(41):E5608-17.
doi: 10.1073/pnas.1510132112. Epub 2015 Sep 29.

Regulation of calreticulin-major histocompatibility complex (MHC) class I interactions by ATP

Affiliations

Regulation of calreticulin-major histocompatibility complex (MHC) class I interactions by ATP

Sanjeeva Joseph Wijeyesakere et al. Proc Natl Acad Sci U S A. .

Abstract

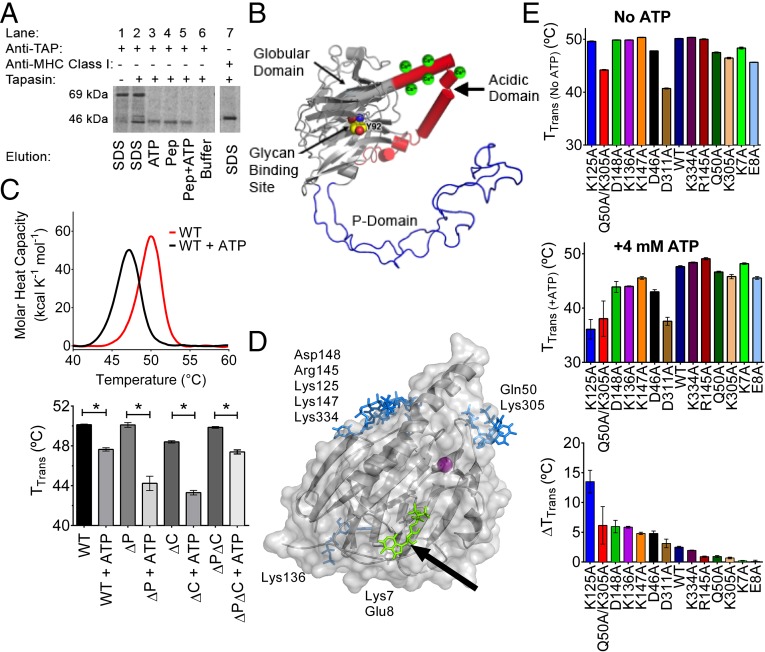
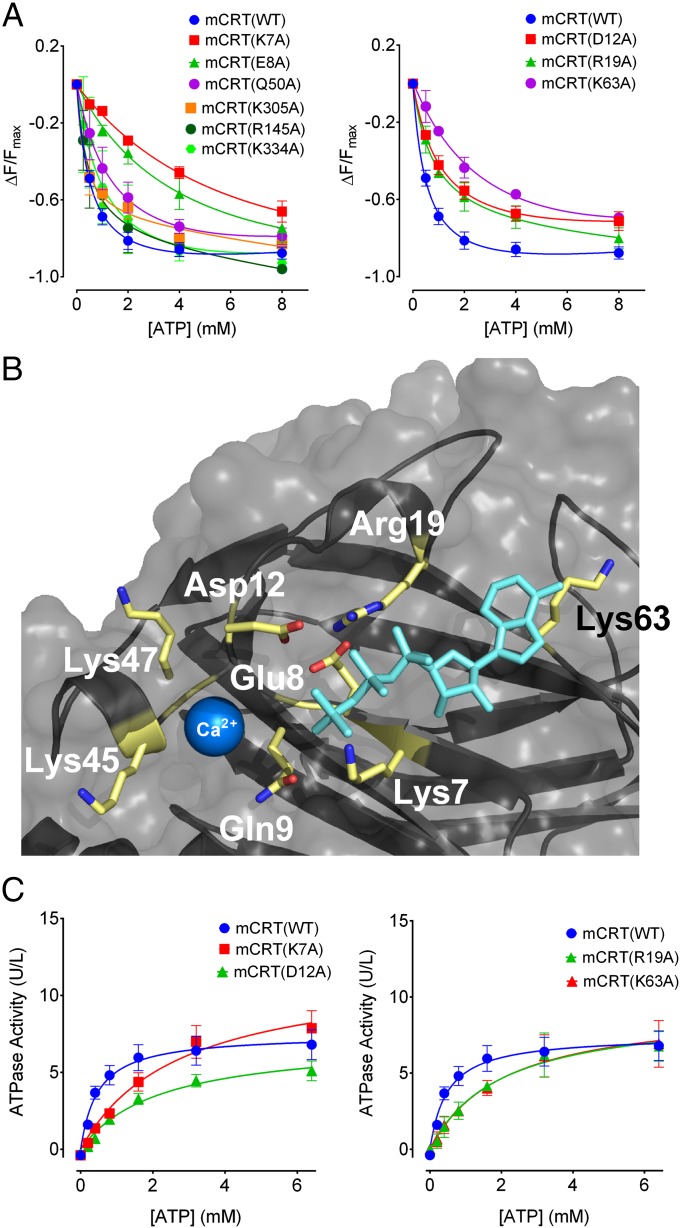
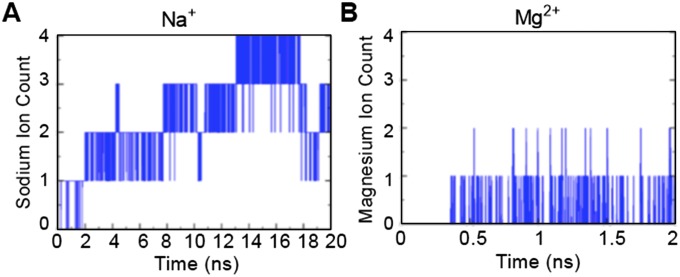
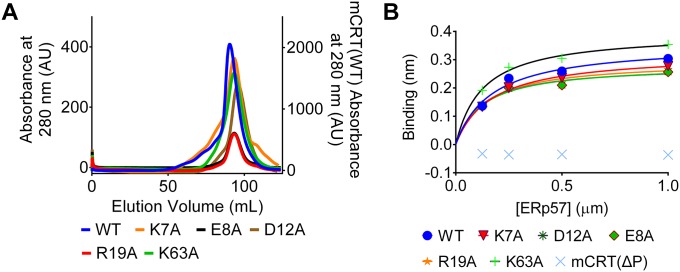
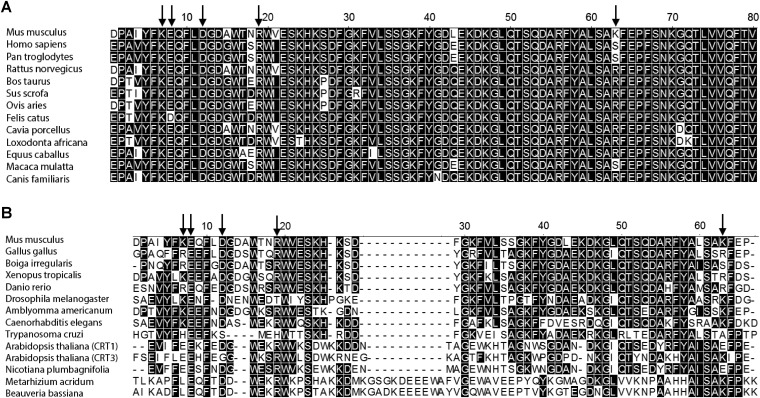
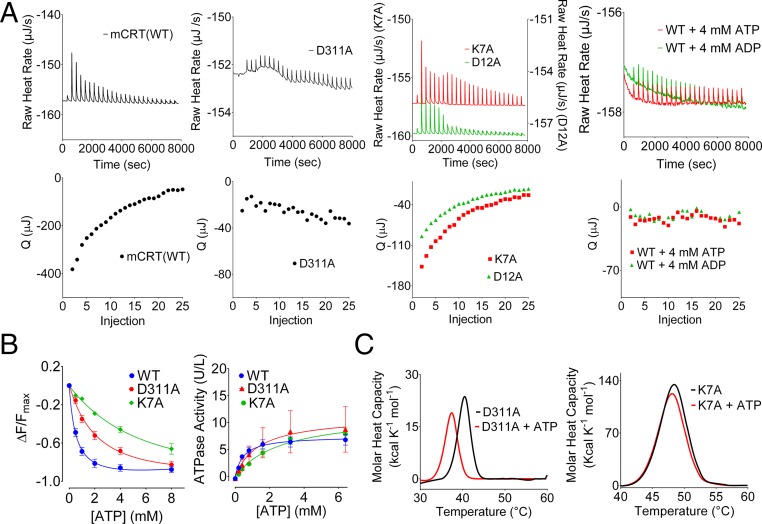
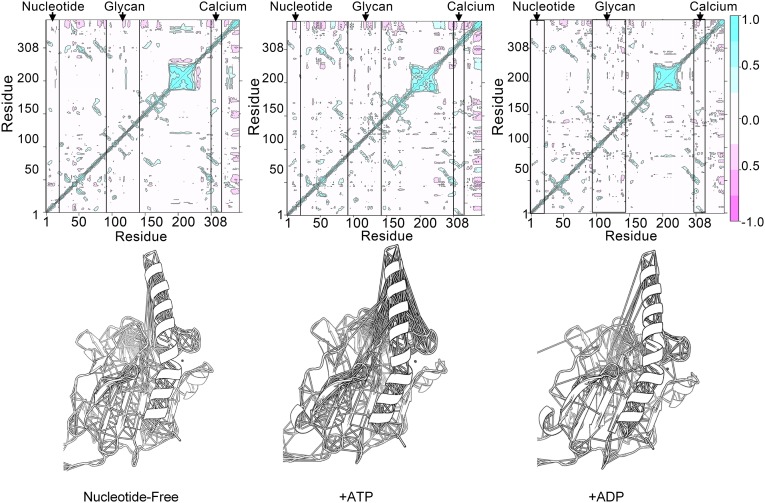
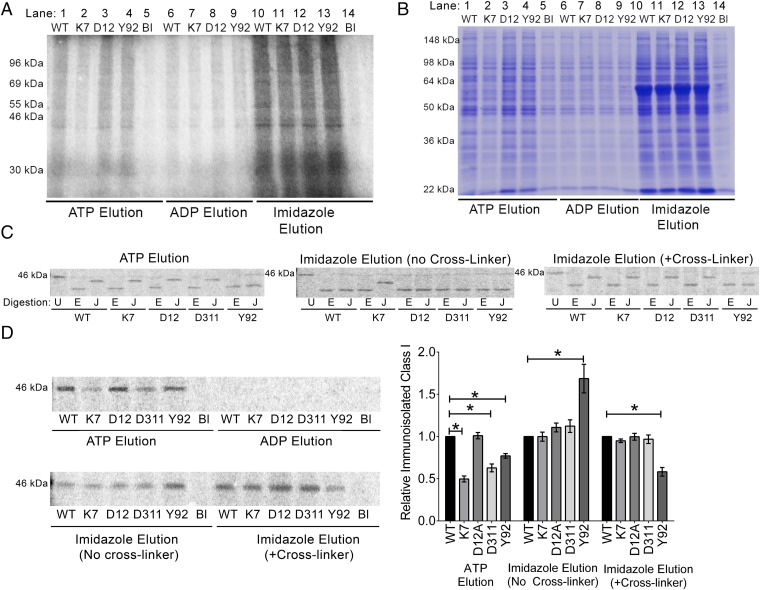
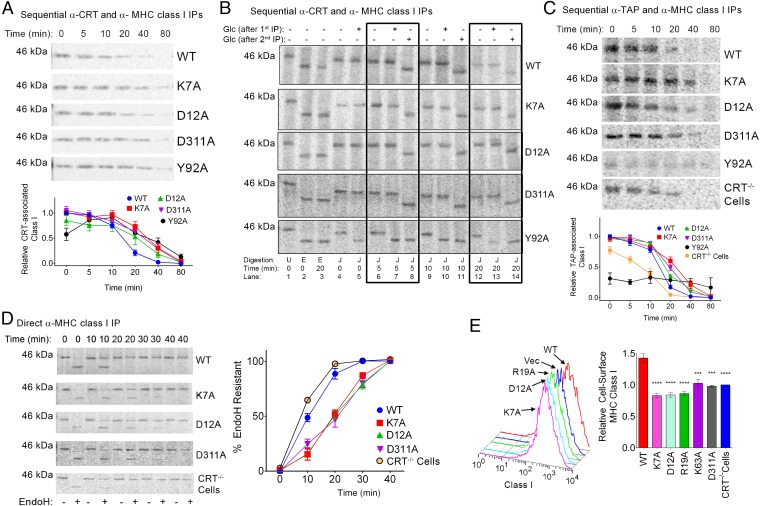
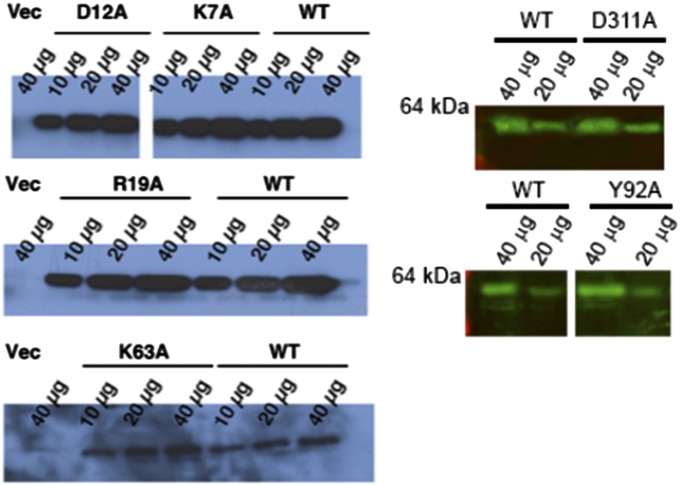
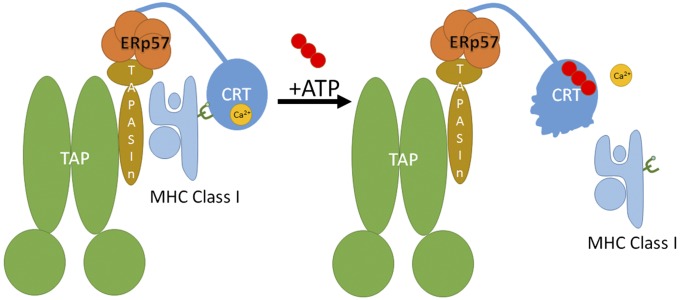
The MHC class I peptide loading complex (PLC) facilitates the assembly of MHC class I molecules with peptides, but factors that regulate the stability and dynamics of the assembly complex are largely uncharacterized. Based on initial findings that ATP, in addition to MHC class I-specific peptide, is able to induce MHC class I dissociation from the PLC, we investigated the interaction of ATP with the chaperone calreticulin, an endoplasmic reticulum (ER) luminal, calcium-binding component of the PLC that is known to bind ATP. We combined computational and experimental measurements to identify residues within the globular domain of calreticulin, in proximity to the high-affinity calcium-binding site, that are important for high-affinity ATP binding and for ATPase activity. High-affinity calcium binding by calreticulin is required for optimal nucleotide binding, but both ATP and ADP destabilize enthalpy-driven high-affinity calcium binding to calreticulin. ATP also selectively destabilizes the interaction of calreticulin with cellular substrates, including MHC class I molecules. Calreticulin mutants that affect ATP or high-affinity calcium binding display prolonged associations with monoglucosylated forms of cellular MHC class I, delaying MHC class I dissociation from the PLC and their transit through the secretory pathway. These studies reveal central roles for ATP and calcium binding as regulators of calreticulin-substrate interactions and as key determinants of PLC dynamics.

Keywords: ATP; ATPase; MHC class; calreticulin; monoglucosylated glycans.


Conflict of interest statement

The authors declare no conflict of interest.

Figures

Fig. 1.
Fig. 1.
ATP induces dissociation of MHC class I from the PLC (A) and interacts with the globular domain of calreticulin (BE). (A) Gel panel shows a representative anti-TAP IP of lysates from [35S]-methionine–labeled CRT−/− MEFs expressing mCRT(WT). The resulting IPs were eluted with SDS (lanes 1 and 2), ATP (lane 3), the SIINFEKL peptide (Pep; lane 4), the SIINFEKL peptide together with ATP (lane 5), or buffer alone (lane 6). Lane 1 is a negative control of an anti-TAP IP using lysates from tapasin-deficient cells that are impaired for MHC class I-TAP binding. Lane 7 shows a direct MHC class I (Y3) IP from CRT−/− MEFs to mark the migration position of MHC class I. Data are representative of three independent experiments. (B) Model for calreticulin showing its globular, P-terminal, and C-terminal domains. The globular domain structure (gray) is based on PDB ID code 3O0V (15), the P-domain structure (blue) is based on PDB ID code 1HHN (45), and the P-domain orientation is modeled based on PDB ID code 3RG0 (16). The acidic domain [modeled de novo using I-TASSER (46)] is indicated in red, with multiple low-affinity calcium-binding sites (shown as green spheres). The glycan-binding residue Tyr92 on the concave surface of the globular domain is indicated (atoms are represented as spheres with carbon colored yellow, oxygen colored red, and nitrogen colored blue). (C, Upper) Representative DSC thermograms showing the thermostability of calreticulin in the absence or presence of 4 mM ATP. (C, Lower) Quantification of thermostability change (TTrans) values for calreticulin constructs containing or lacking the P-domain, acidic domain, or both [mCRT(ΔP), mCRT(ΔC), and mCRT(ΔPΔC)] in the presence or absence of 4 mM ATP. Data show the mean ± SEM from two to three [mCRT(ΔC), mCRT(ΔP), and mCRT(ΔPΔC)] or 27 [mCRT(WT)] independent experiments. Statistically significant differences in the mean TTrans values (assessed via a one-way ANOVA, followed by a Tukey’s post hoc test) are denoted (*). (D) Global docking of ATP to the globular domain of mCRT [PDB ID code 3O0V (15)]. Key nucleotide-interacting residues from each cluster are noted. An arrow denotes the cluster of poses in close proximity to Lys7 (green). (E) Interaction of calreticulin point mutants with ATP. Plots show the mean TTrans values (±SEM) in the absence of ATP (Upper) and in the presence of 4 mM ATP (Middle), and the ATP-induced change in the TTrans values (ΔTTrans) (Lower). Data represent the mean TTrans ± SEM from two to four (mutants) or 27 [mCRT(WT)] independent experiments.
Fig. 2.
Fig. 2.
Residues in proximity to the high-affinity calcium-binding site of calreticulin affect ATP binding and hydrolysis. (A) Plots showing the dose-dependent quenching of the intrinsic Trp fluorescence of the indicated calreticulin constructs in the presence of varying concentrations of ATP. Derived binding constants and numbers of experimental replicates are shown in Table 1. (B) Time-averaged structure of the highest scoring pose of ATP docked within the putative nucleotide-binding site defined by Lys7. Lys7, Glu8, Asp12, Arg19, and Lys63 are shown as sticks. The Ca2+ ion is shown as a blue sphere within the previously defined high-affinity calcium-binding site [from PDB ID code 3O0V (15)]. (C) Michaelis–Menten kinetic plots depicting ATP hydrolysis as a function of ATP concentration. Data show mean ± SEM, with Michaelis constants and data replicates shown in Table 1.
Fig. S1.
Fig. S1.
Divalent cations can interact with the γ-phosphate of ATP over the course of an MD simulation. Sodium (A) or magnesium (B) ions from the bulk solvent can interact stably with the γ-phosphate moiety of ATP, thereby orienting it (the γ-phosphate of ATP) with Asp12 and Arg19 of calreticulin. Figure panels show the number of Na+ and Mg2+ ions associated with the γ-phosphate of ATP over the indicated simulation time frame.
Fig. S2.
Fig. S2.
Calreticulin constructs used in this study are nonaggregated and functional for cochaperone binding via the P-domain. (A) Representative gel filtration profiles (using a Highload 16/60 Superdex 200 gel filtration column; GE) for the nucleotide-binding/hydrolysis-deficient calreticulin constructs used in this study. Proteins were analyzed following their elution from a Ni-NTA affinity column. In the gel filtration analyses, protein elution volumes were variable between different protein preparations (±5% of column volume) based on the protein yields, column equilibration time, and system pressure. AU, absorbance units. (B) Representative steady-state analysis [as assessed via biolayer interferometry (BLI)] of the interaction between the indicated calreticulin constructs (immobilized on the biosensor) and varying concentrations of ERp57. All indicated calreticulin constructs are able to interact with ERp57, with the exception of mCRT(∆P), which lacks the P-domain that contains the ERp57-binding site in calreticulin. Data show representative plots from two independent experiments.
Fig. S3.
Fig. S3.
Identified ATP-binding site is conserved across the mammalian calreticulins. ClustalW sequence alignments of the N terminus of mCRT with representative mammalian orthologs (A) as well as representative avian, reptile, amphibian, insect, parasite, and plant orthologs (B) are shown. Arabidopsis thaliana is known to express three calreticulin constructs from two distinct groups (CRT1/2 and CRT3) (51), and the sequence alignment shows CRT1 and CRT3 from A. thaliana. Conserved residues are shaded in black, and residues corresponding to Lys7, Glu8, Asp12, Arg19, and Lys63 in mCRT are indicated by arrows.
Fig. 3.
Fig. 3.
Influences of nucleotides on calcium binding and of a calcium-binding site mutant on nucleotide binding. (A) Representative ITC thermograms depicting the binding of calcium to the high-affinity calcium-binding sites of the indicated calreticulin constructs in the absence or presence of 4 mM ATP or ADP. Plots show raw titration curves (Upper) and the corresponding curve fits (Lower). Data are representative of two to four [mCRT mutants: mCRT(WT) + ATP and mCRT(WT) + ADP] or nine [mCRT(WT)] independent experiments. Q, area of the indicated injection peak. (B, Left) Dose-dependent quenching of the Trp fluorescence of the indicated calreticulin constructs in the presence of varying concentrations of ATP. (B, Right) Michaelis–Menten kinetic plots and associated best global fit showing the rate of ATP hydrolysis by the indicated calreticulin constructs. Data show mean ± SEM. Binding and kinetic constants, along with data replicates, are shown in Table 1. ΔF, change in the intrinsic Trp fluorescence peak value relative to the ATP-free state; Fmax, intrinsic Trp fluorescence peak value in the absence of ATP. (C) Representative DSC thermograms (of three to four independent experiments) showing ATP-induced thermostability changes for mCRT(D311A) (Left) and mCRT(K7A) (Right).
Fig. 4.
Fig. 4.
ATP increases correlated residue motions in the globular domain of calreticulin. MD simulations were run of calreticulin in complex with G1M3 in the absence of nucleotides (Left) or in the presence of ATP (Middle) or ADP (Right). The figure shows the covariance matrices (Upper) and associated models of the globular domain of calreticulin with lines connecting the Cα atoms of residues whose motions were highly correlated (|r| > 0.5) over the course of the simulations (Lower). The covariance matrices are scaled from −1.0 (pink) to 1 (cyan). Cyan regions indicate that the Cα atoms move in a concerted way (positively correlated movements), and pink indicates opposite movements (anticorrelated motions). Levels are colored in increments of 0.25. Boxes denoted by arrows highlight residues surrounding the nucleotide (residues K7, E8, D12, and R19), glycan (residues Y92, K94, G107, D108, Y111, D118, and N137), and high-affinity calcium-binding (residue D311) sites in calreticulin. Correlated motions between the distant glycan- and ATP-binding regions are present in the ATP-bound state but are missing in the absence of nucleotides or in the presence of ADP. Note that the residue numbering is discontinuous from residue 228 onward to match the numbering in the X-ray structure [PDB ID code 3RG0 (16)] due to the P-domain truncation.
Fig. 5.
Fig. 5.
ATP destabilizes the interaction of calreticulin with cellular substrates. Lysates from calreticulin-deficient MEFs that were [35S]-methionine–labeled (A, C, and D) or unlabeled (B) were incubated with the indicated nickel-resin–immobilized calreticulin [WT = mCRT(WT), K7 = mCRT(K7A), D12 = mCRT(D12A), D311 = mCRT(D311A), and Y92 = mCRT(Y92A)] or nickel-resin alone (Bl). Following washes, protein elutions were performed with ATP, ADP, or imidazole as indicated. Total protein eluates were analyzed by SDS/PAGE and phosphorimaging (A) or Coomassie staining (B). MHC class I was further immunoprecipitated from the indicated bead eluates, enzymatically digested (C) or directly quantified (D), and visualized by SDS/PAGE and phosphorimaging. (C) EndoH digests are labeled E, JBM digests are labeled J, and undigested protein is labeled U. (Right) Lysates were bound to beads in the presence of the reversible cross-linker dimethyl 3,3′-dithiobispropionimidate before washing beads and elution with imidazole. Data are representative of five ATP vs. ADP eluate comparisons (A), three ATP vs. ADP eluate comparisons (B), two to four (D311A ATP and imidazole elutions) or seven to 12 (other constructs) (C), and five to six (D311A and D12A) or 10–17 (other constructs) (D) independent analyses. (D, Right) Quantification of the levels of immunoisolated MHC class I, averaged from all replicates [each normalized to the corresponding mCRT(WT) signals]. Data show mean ± SEM, with statistical significance assessed via a two-way ANOVA followed by a Dunnett’s post hoc test. Statistically significant means are indicated (*).
Fig. 6.
Fig. 6.
Delayed maturation kinetics and suboptimal assembly of MHC class I molecules in cells expressing calreticulin mutants that disrupt ATP or high-affinity calcium binding: CRT−/− MEFs were infected with retroviruses encoding the indicated calreticulin constructs and further analyzed for MHC class I interactions with calreticulin (A and B) or TAP (C), or for their rates of maturation (D) and cell surface expression (E). (AD) MEFs expressing the indicated calreticulin constructs were [35S]-methionine–labeled and chased for the indicated times, and proteins in lysates were immunoprecipitated as indicated. Recovered proteins were visualized by SDS/PAGE and phosphorimaging analyses. (A and B) Sequential anti-calreticulin (first IP) and anti-MHC class I (second IP) IPs were performed on cell lysates. (A) mCRT-associated MHC class I levels were quantified at the indicated time points. (B) Immunoprecipitated proteins were digested with J or E following the second IP. Additionally, Glc was present after the first or second IP as indicated. Boxes highlight the 5- and 20-min time points of the chase. (C) Sequential anti-TAP (first IP) and anti-MHC class I (second IP) IPs were performed on cell lysates, and TAP-associated MHC class I levels were assessed. (D) Direct anti-MHC class I IPs were performed, and the immunoisolated protein was digested with endoH. Graphs show data averaged across four to nine (A), two to five (C), and three to four (D) independent analyses from two to four independent infections. All signals were normalized relative to the mCRT(WT) signal at the zero time point analyzed within the same experiment. (E) Flow cytometric analyses of cell surface MHC class I expression. (Left) Representative histograms depicting the cell-surface MHC class I levels in MEFs expressing the indicated calreticulin constructs or lacking calreticulin expression (Vec). (Right) Mean cell surface MHC class I levels ± SEM normalized to cells lacking calreticulin expression (Vec or CRT−/− cells). Data represent the average of four to seven [mCRT(D311A), mCRT(D12A), mCRT(R19A), and mCRT(K63A)], 15 [mCRT(K7A)], or 22 [mCRT(WT) and CRT−/− cells] independent experiments. Statistical significance was assessed via a one-way ANOVA followed by a Dunnett’s post hoc test, with statistically significant means [relative to mCRT(WT)] denoted (*).
Fig. S4.
Fig. S4.
Assessment of calreticulin expression in cells. CRT−/− MEFs were infected with retroviruses to express the indicated calreticulin constructs. Following infection, cells were lysed and calreticulin levels in the cell lysates were assessed by immunoblotting, followed by detection via chemiluminescence (Left) or fluorescence (Right). The figure shows representative immunoblots from 12 to 15 [mCRT(WT) and Vec], six to nine [mCRT(K7A) and mCRT(D12A)], five [mCRT(R19A)], or two to three [mCRT(K63A) and mCRT(D311A)] independent infections.
Fig. 7.
Fig. 7.
Proposed role for ATP in promoting the release of MHC class I from the PLC. Within the PLC, calreticulin functions as a chaperone to stabilize MHC class I interactions with the PLC. Interaction of calreticulin with ATP is predicted to destabilize the globular domain of calreticulin, thereby releasing the folded MHC class I in addition to dissociating the high-affinity calcium ion from the globular domain of calreticulin. Whether ATP is hydrolyzed during this step needs further assessment.

References

    1. Blum JS, Wearsch PA, Cresswell P. Pathways of antigen processing. Annu Rev Immunol. 2013;31:443–473. - PMC - PubMed
    1. Raghavan M, Wijeyesakere SJ, Peters LR, Del Cid N. Calreticulin in the immune system: Ins and outs. Trends Immunol. 2013;34(1):13–21. - PMC - PubMed
    1. Rizvi SM, Del Cid N, Lybarger L, Raghavan M. Distinct functions for the glycans of tapasin and heavy chains in the assembly of MHC class I molecules. J Immunol. 2011;186(4):2309–2320. - PMC - PubMed
    1. Wearsch PA, Peaper DR, Cresswell P. Essential glycan-dependent interactions optimize MHC class I peptide loading. Proc Natl Acad Sci USA. 2011;108(12):4950–4955. - PMC - PubMed
    1. Gao B, et al. Assembly and antigen-presenting function of MHC class I molecules in cells lacking the ER chaperone calreticulin. Immunity. 2002;16(1):99–109. - PubMed

Publication types

MeSH terms