. 2015 Oct 13;112(41):12711-6.
doi: 10.1073/pnas.1501597112. Epub 2015 Sep 29.

Connectivity Map-based discovery of parbendazole reveals targetable human osteogenic pathway

Affiliations

Connectivity Map-based discovery of parbendazole reveals targetable human osteogenic pathway

Andrea M Brum et al. Proc Natl Acad Sci U S A. .

Abstract

Osteoporosis is a common skeletal disorder characterized by low bone mass leading to increased bone fragility and fracture susceptibility. In this study, we have identified pathways that stimulate differentiation of bone forming osteoblasts from human mesenchymal stromal cells (hMSCs). Gene expression profiling was performed in hMSCs differentiated toward osteoblasts (at 6 h). Significantly regulated genes were analyzed in silico, and the Connectivity Map (CMap) was used to identify candidate bone stimulatory compounds. The signature of parbendazole matches the expression changes observed for osteogenic hMSCs. Parbendazole stimulates osteoblast differentiation as indicated by increased alkaline phosphatase activity, mineralization, and up-regulation of bone marker genes (alkaline phosphatase/ALPL, osteopontin/SPP1, and bone sialoprotein II/IBSP) in a subset of the hMSC population resistant to the apoptotic effects of parbendazole. These osteogenic effects are independent of glucocorticoids because parbendazole does not up-regulate glucocorticoid receptor (GR) target genes and is not inhibited by the GR antagonist mifepristone. Parbendazole causes profound cytoskeletal changes including degradation of microtubules and increased focal adhesions. Stabilization of microtubules by pretreatment with Taxol inhibits osteoblast differentiation. Parbendazole up-regulates bone morphogenetic protein 2 (BMP-2) gene expression and activity. Cotreatment with the BMP-2 antagonist DMH1 limits, but does not block, parbendazole-induced mineralization. Using the CMap we have identified a previously unidentified lineage-specific, bone anabolic compound, parbendazole, which induces osteogenic differentiation through a combination of cytoskeletal changes and increased BMP-2 activity.

Keywords: Connectivity Map; cytoskeleton; mesenchymal stem cell; osteoblast; osteoporosis.


Conflict of interest statement

The authors declare no conflict of interest.

Figures

Fig. 1.
Fig. 1.
Parbendazole induces osteogenic differentiation of hMSCs. Results of ALP activity after 1 wk of culture (A) and mineralization after 3 wk of culture (B) in hMSCs treated with 1 μM parbendazole (light gray bar), 4 μM parbendazole (dark gray bar) compared with negative control (control medium; white bar) or positive control (0.1 μM dex; black bar) treated cells. (C) Dose-dependent induction of mineralization was confirmed by alizarin red staining after 3 wk of culture. mRNA expression levels of ALPL (D), IBSP (E), and SPP1 (F) 7 d after the start of treatment with control medium (white bar), 4 μM parbendazole (gray bar), or 0.1 μM dex (black bar) as assessed by quantitative PCR. For biochemistry, n = 12. For PCRs, n = 6. *P < 0.05, **P < 0.01, ***P < 0.001. Results are presented relative to control.
Fig. S1.
Fig. S1.
Parbendazole does not induce osteogenic differentiation in human preosteoblast cells (SV-HFOs), but does reduce total protein. Results of mineralization (A) and total protein content (B) after 3 wk of culture in SV-HFOs treated with 1 μM parbendazole (light gray bar), 100 nM parbendazole (medium gray bar), and 10 nM parbendazole (dark gray bar) compared with negative control (control medium; black bar) or positive control (100 nM dex; darkest gray bar) treated cells. n = 3. Results are of one representative experiment.
Fig. 2.
Fig. 2.
Parbendazole treatment decreases cell viability by increasing apoptosis. (A) FACS assessment of hMSCs treated with control medium (white bar), 4 μM parbendazole (gray bar), or 0.1 μM dex (black bar) and stained with annexin to determine combined early and late apoptosis. (B) FACS assessment of hMSCs treated with control medium (white bar), 4 μM parbendazole (gray bar), or 0.1 μM dex (black bar) and stained with Ki67 to determine proliferation (n = 7). (C) Relative cell viability was assessed by PrestoBlue assay as represented by the relative fluorescence units (RFU). *P < 0.05, **P < 0.01, ***P < 0.001. Results are presented relative to control at each time point.
Fig. 3.
Fig. 3.
Parbendazole-induced osteoblast differentiation is independent of glucocorticoid receptor signaling. (A–C) Quantitative PCR results from hMSCs incubated with parbendazole and from control hMSCs either undifferentiated or differentiated with dex. Relative gene expression of direct glucocorticoid receptor signaling targets, ZNF145 (A), GILZ (B), and FKBP51 (C) of hMSCs treated with control medium (white bar), 4 μM parbendazole (gray bar), or 0.1 μM dex (black bar) for 24 h. Biochemical assays for ALP (day 6) (D) and mineralization (week 3) (E) of hMSCs treated with control medium (white bar), 4 μM parbendazole (gray bar), or 0.1 μM dex (black bar) with (patterned bars) or without (solid bars) the GR antagonist, mifepristone, throughout the culture period (n = 6). **P < 0.01, ***P < 0.001. Results are presented relative to control at each time point.
Fig. 4.
Fig. 4.
Parbendazole inhibition of microtubule polymerization is required for parbendazole-induced osteogenic differentiation. Mineralization in hMSCs treated with control medium (white bar) or 4 μM parbendazole (gray bar) in combination with (striped bars) or without (solid bars) the microtubule-stabilizing drug Taxol (n = 6). ***P < 0.001. Results are presented relative to control.
Fig. S2.
Fig. S2.
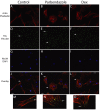
Parbendazole inhibits microtubule polymerization. hMSCs were incubated with control medium (A, D, G, and J), 4 μM parbendazole (B, E, H, and K), or 0.1 μM dex (C, F, I, and L) for 4 d, and then the actin and tubulin cytoskeleton were visualized by immunofluorescence microscopy using phalloidin and β-tubulin antibodies. Parbendazole treatment inhibits microtubule formation (E and K), with only small microtubules remaining perinuclear (white arrow). Crossing of the actin microfilaments can also be seen in parbendazole-treated cells (white stars in B). (Magnification: 630×.)
Fig. 5.
Fig. 5.
Parbendazole increases number and length of focal adhesions. Quantification of the number (A) and length (B) of focal adhesions was performed on control, parbendazole, and dex-treated hMSCs (n = 28–30 cells). *P < 0.05, **P < 0.01, ***P < 0.001.
Fig. S3.
Fig. S3.
Parbendazole affects focal adhesions. hMSCs were incubated with control medium (A, D, G, J, M), 4 μM parbendazole (B, E, H, K, N), or 0.1 μM dex (C, F, I, L, O) for 24 h, and actin microfilaments and FAs were visualized by immunofluorescence microscopy using phalloidin and vinculin antibodies. FAs are identified by the filled arrowheads. Crossing of the actin microfilaments can also be seen in parbendazole-treated cells (white stars in B). (Magnification 400×.) (Scale bar: 20 μM.)
Fig. 6.
Fig. 6.
Parbendazole regulates BMP-2 expression and activity. (A) Gene expression of BMP2 after treating hMSCs for 24 h with control medium (white bar), 4 μM parbendazole (gray bar), or dex (black bars). (B) Luciferase reporter assay for BMP signaling reporter BRE-Luc of control medium (solid white bar), conditioned medium from hMSCs treated from control (white patterned bar), 4 μM parbendazole for 48 h (gray patterned bar), or 0.1 μM dex (black patterned bar) for 48 h, and the positive control, recombinant BMP-2 protein (black bar). (C) Pretreatment of hMSCs with the BMP inhibitor DMH1 (patterned bars) enhances mineralization. Relative mineralization in hMSCs cultures following control (white bar), DMH1 (white patterned bar), parbendazole (gray bar), and parbendazole + DMH1 (gray patterened bar) treatment. n = 6. ***P < 0.001 by one-way ANOVA. ###P < 0.001 by two-way ANOVA. Results are presented relative to control.

References

    1. Johnell O, Kanis JA. An estimate of the worldwide prevalence and disability associated with osteoporotic fractures. Osteoporos Int. 2006;17(12):1726–1733. - PubMed
    1. Kanis JA, Johnell O. Requirements for DXA for the management of osteoporosis in Europe. Osteoporos Int. 2005;16(3):229–238. - PubMed
    1. Lamb J, et al. The Connectivity Map: Using gene-expression signatures to connect small molecules, genes, and disease. Science. 2006;313(5795):1929–1935. - PubMed
    1. Qu XA, Rajpal DK. Applications of Connectivity Map in drug discovery and development. Drug Discov Today. 2012;17(23-24):1289–1298. - PubMed
    1. Chang M, Smith S, Thorpe A, Barratt MJ, Karim F. Evaluation of phenoxybenzamine in the CFA model of pain following gene expression studies and connectivity mapping. Mol Pain. 2010;6:56. - PMC - PubMed

Publication types

MeSH terms

LinkOut - more resources