

Hypoxia Strongly Affects Mitochondrial Ribosomal Proteins and Translocases, as Shown by Quantitative Proteomics of HeLa Cells
- PMID: 26421188
- PMCID: PMC4572459
- DOI: 10.1155/2015/678527
Hypoxia Strongly Affects Mitochondrial Ribosomal Proteins and Translocases, as Shown by Quantitative Proteomics of HeLa Cells
Abstract
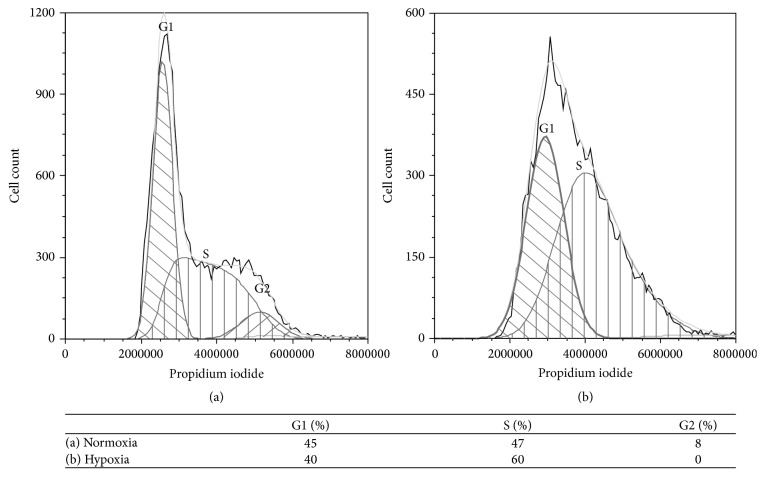
Hypoxia is an important and common characteristic of many human tumors. It is a challenge clinically due to the correlation with poor prognosis and resistance to radiation and chemotherapy. Understanding the biochemical response to hypoxia would facilitate the development of novel therapeutics for cancer treatment. Here, we investigate alterations in gene expression in response to hypoxia by quantitative proteome analysis using stable isotope labeling with amino acids in cell culture (SILAC) in conjunction with LCMS/MS. Human HeLa cells were kept either in a hypoxic environment or under normoxic conditions. 125 proteins were found to be regulated, with maximum alteration of 18-fold. In particular, three clusters of differentially regulated proteins were identified, showing significant upregulation of glycolysis and downregulation of mitochondrial ribosomal proteins and translocases. This interaction is likely orchestrated by HIF-1. We also investigated the effect of hypoxia on the cell cycle, which shows accumulation in G1 and a prolonged S phase under these conditions. Implications. This work not only improves our understanding of the response to hypoxia, but also reveals proteins important for malignant progression, which may be targeted in future therapies.
Figures


Similar articles
-
Analysis of protein expression during oxidative stress in breast epithelial cells using a stable isotope labeled proteome internal standard.J Proteome Res. 2005 Nov-Dec;4(6):2007-14. doi: 10.1021/pr050175d. J Proteome Res. 2005. PMID: 16335945
-
Expression of AGPAT2, an enzyme involved in the glycerophospholipid/triacylglycerol biosynthesis pathway, is directly regulated by HIF-1 and promotes survival and etoposide resistance of cancer cells under hypoxia.Biochim Biophys Acta Mol Cell Biol Lipids. 2018 Sep;1863(9):1142-1152. doi: 10.1016/j.bbalip.2018.06.015. Epub 2018 Jun 15. Biochim Biophys Acta Mol Cell Biol Lipids. 2018. PMID: 29908837
-
Mutant p53R248Q downregulates oxidative phosphorylation and upregulates glycolysis under normoxia and hypoxia in human cervix cancer cells.J Cell Physiol. 2019 May;234(5):5524-5536. doi: 10.1002/jcp.27354. Epub 2018 Sep 10. J Cell Physiol. 2019. PMID: 30272821
-
Solid tumor physiology and hypoxia-induced chemo/radio-resistance: novel strategy for cancer therapy: nitric oxide donor as a therapeutic enhancer.Nitric Oxide. 2008 Sep;19(2):205-16. doi: 10.1016/j.niox.2008.04.026. Epub 2008 May 6. Nitric Oxide. 2008. PMID: 18503779 Review.
-
Stable Isotope Labeling by Amino Acids in Cell Culture (SILAC) for Quantitative Proteomics.Adv Exp Med Biol. 2019;1140:531-539. doi: 10.1007/978-3-030-15950-4_31. Adv Exp Med Biol. 2019. PMID: 31347069 Review.
Cited by
-
Bioactive constituents of Salvia przewalskii and the molecular mechanism of its antihypoxia effects determined using quantitative proteomics.Pharm Biol. 2020 Dec;58(1):469-477. doi: 10.1080/13880209.2020.1762668. Pharm Biol. 2020. PMID: 32476549 Free PMC article.
-
Quantitative Proteomic Approach Reveals Altered Metabolic Pathways in Response to the Inhibition of Lysine Deacetylases in A549 Cells under Normoxia and Hypoxia.Int J Mol Sci. 2021 Mar 25;22(7):3378. doi: 10.3390/ijms22073378. Int J Mol Sci. 2021. PMID: 33806075 Free PMC article.
-
Computational modeling to determine key regulators of hypoxia effects on the lactate production in the glycolysis pathway.Sci Rep. 2020 Jun 8;10(1):9163. doi: 10.1038/s41598-020-66059-w. Sci Rep. 2020. PMID: 32514127 Free PMC article.
-
Multichannel Recovery Potential with Activated Autologous Intraovarian Platelet-Rich Plasma and Its Derivatives.Medicines (Basel). 2023 Jul 3;10(7):40. doi: 10.3390/medicines10070040. Medicines (Basel). 2023. PMID: 37505061 Free PMC article.
-
Temporal Quantitative Proteomics Reveals Proteomic and Phosphoproteomic Alterations Associated with Adaptive Response to Hypoxia in Melanoma Cells.Cancers (Basel). 2021 Apr 30;13(9):2175. doi: 10.3390/cancers13092175. Cancers (Basel). 2021. PMID: 33946525 Free PMC article.
References
-
- Vaupel P., Kallinowski F., Okunieff P. Blood flow, oxygen and nutrient supply, and metabolic microenvironment of human tumors: a review. Cancer Research. 1989;49(23):6449–6465. - PubMed
-
- Lee Y. M., Jeong C.-H., Koo S.-Y., et al. Determination of hypoxic region by hypoxia marker in developing mouse embryos in vivo: a possible signal for vessel development. Developmental Dynamics. 2001;220(2):175–186. doi: 10.1002/1097-0177(20010201)220:260;175::aid-dvdy110162;3.0.co;2-f. - DOI - PubMed
-
- Brizel D. M., Scully S. P., Harrelson J. M., et al. Tumor oxygenation predicts for the likelihood of distant metastases in human soft tissue sarcoma. Cancer Research. 1996;56(5):941–943. - PubMed
LinkOut - more resources
Full Text Sources
Other Literature Sources