. 2015 Sep 24:3:e1237.
doi: 10.7717/peerj.1237. eCollection 2015.

Modeling historical tuberculosis epidemics among Canadian First Nations: effects of malnutrition and genetic variation

Affiliations

Modeling historical tuberculosis epidemics among Canadian First Nations: effects of malnutrition and genetic variation

Sarah F Ackley et al. PeerJ. .

Abstract

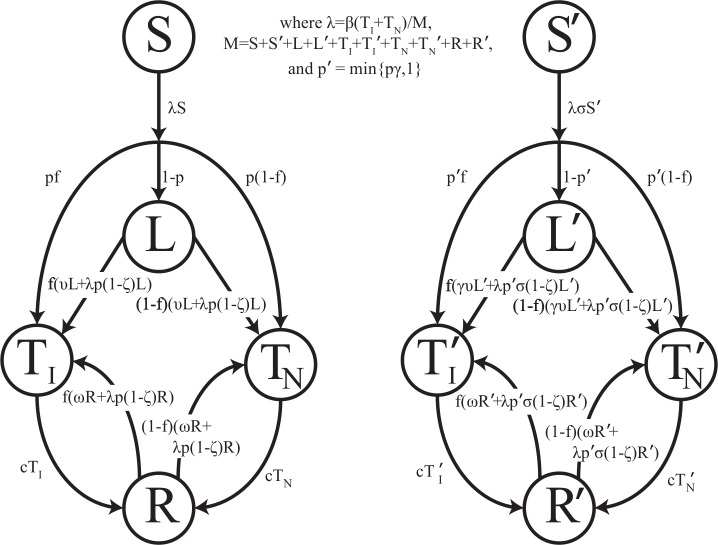
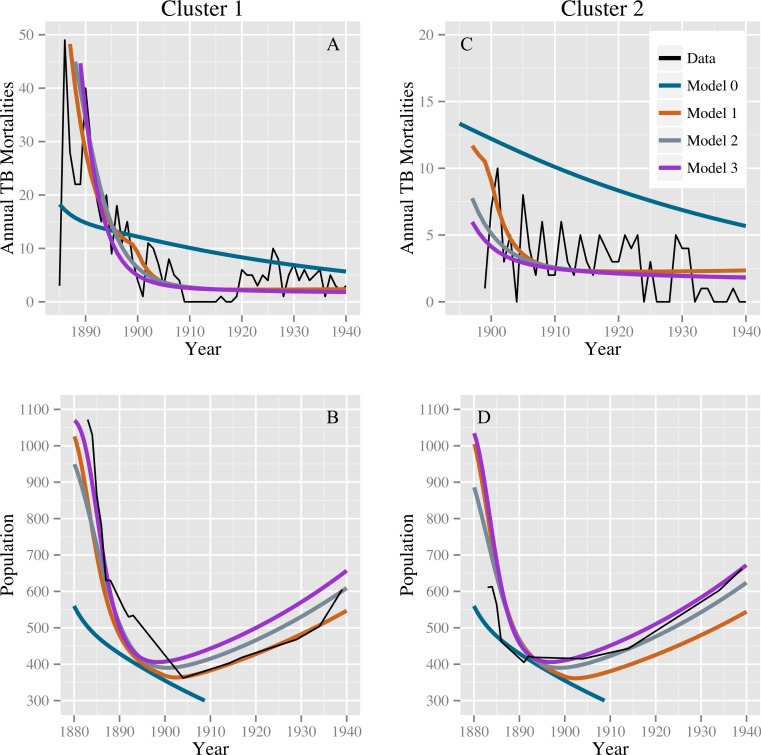
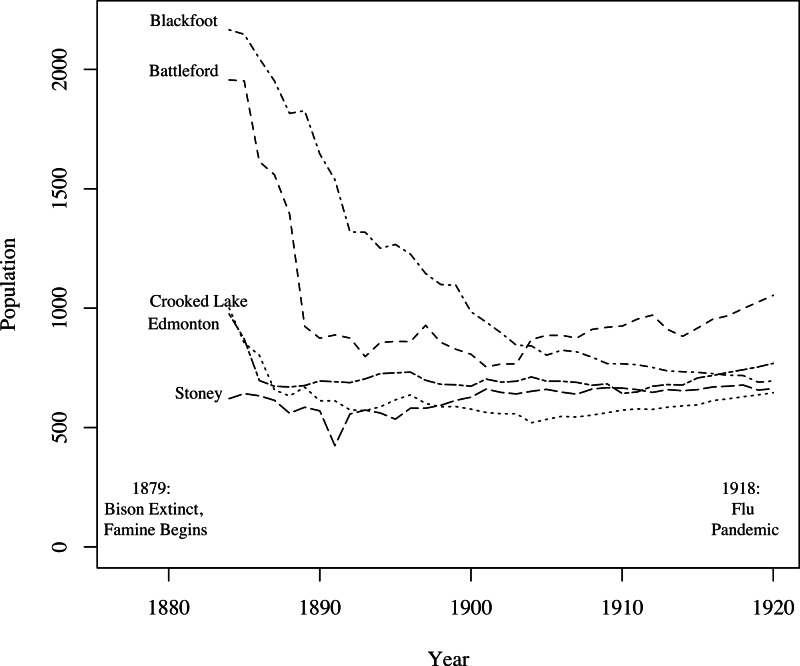
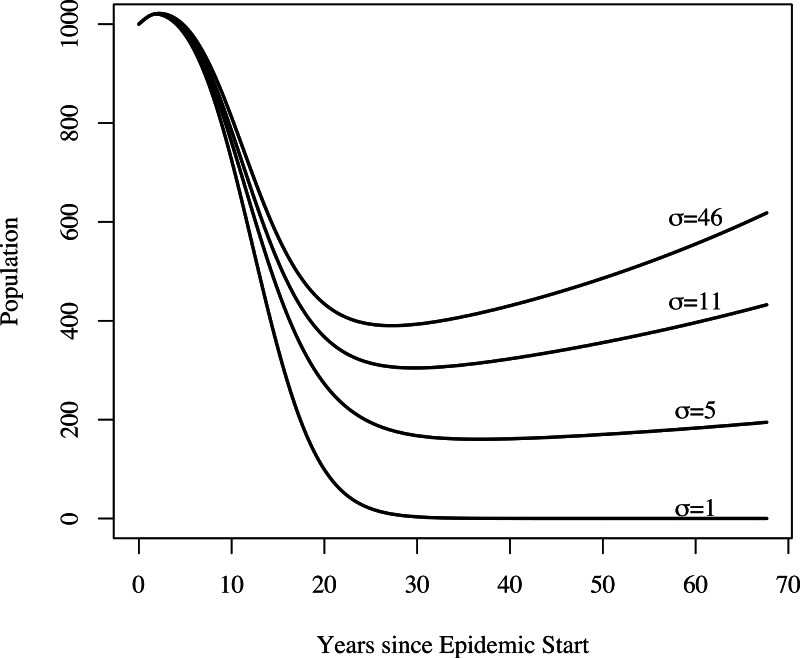
Late 19th century epidemics of tuberculosis (TB) in Western Canadian First Nations resulted in peak TB mortality rates more than six times the highest rates recorded in Europe. Using a mathematical modeling approach and historical TB mortality time series, we investigate potential causes of high TB mortality and rapid epidemic decline in First Nations from 1885 to 1940. We explore two potential causes of dramatic epidemic dynamics observed in this setting: first, we explore effects of famine prior to 1900 on both TB and population dynamics. Malnutrition is recognized as an individual-level risk factor for TB progression and mortality; its population-level effects on TB epidemics have not been explored previously. Second, we explore effects of heterogeneity in susceptibility to TB in two ways: modeling heterogeneity in susceptibility to infection, and heterogeneity in risk of developing disease once infected. Our results indicate that models lacking famine-related changes in TB parameters or heterogeneity result in an implausibly poor fit to both the TB mortality time series and census data; the inclusion of these features allows for the characteristic decline and rise in population observed in First Nations during this time period and confers improved fits to TB mortality data.

Keywords: Epidemics; First Nations; Genetic predisposition to disease; Malnutrition; Mathematical model; Tuberculosis.


Conflict of interest statement

The authors declare there are no competing interests.

Figures

Figure 1
Figure 1. Transmission diagram.
Representation of compartmental TB models 0, 1, 2, and 3. Individuals who are more genetically susceptible are in the primed states, whereas less genetically susceptible individuals are in the unprimed states. S, L, TI, TN, and R represent the numbers of people in the susceptible, latent, infectious active disease, non-infectious active disease, and recovered groups, respectively, as a function of time for the less susceptible group. S′, L′, TI, TN, and R′ represent the numbers of people in the susceptible, latent, infectious active disease, non-infectious active disease, and recovered groups, respectively, as a function of time for the more susceptible group. Model parameters are given in Table 1. For models 0 and 1, no individuals start out in S′, and thus all primed states remain empty. For models 2 and 3, a fraction of individuals start in S′. For model 2, σ ≠ 0 and y = 0. For model 3, σ = 0 and y ≠ 0. For simplicity, background mortality and TB specific mortality were omitted from the diagram.
Figure 2
Figure 2. Model fits to the TB mortality time series and census data.
Model fits to the TB mortality time series and census data for clusters 1 and 2 on the left (A and B, respectively) and right (C and D, respectively), respectively, and for models 0, 1, 2, and 3. Model 0 yields an implausibly poor fit to the TB mortality time series and census data, while models 1, 2, and 3 confer better fits, capturing the characteristic demographic decline and rise.
Figure 3
Figure 3. Graph of the populations of five groups of reserves (agencies) from 1884 to 1920 (Lux, 2001).
For the census data for clusters 1 and 2, refer to Fig. 2. For four of the five agencies, populations decline following the onset of famine; most begin to recover around 1900.
Figure 4
Figure 4. The effect of heterogeneity on population dynamics.
Using the parameters from model 2’s best fit, as we decrease the relative increased susceptibility of the more susceptible group (σ) while keeping the mean susceptibility at the start of the epidemic constant, we see that the population decreases relative to model 2’s best fit. Greater heterogeneity allows us to reproduce the qualitative trend in population numbers of a sharp decrease in numbers followed by a slow increase.
Figure 5
Figure 5. The effect of combinations of famine-related parameters on TB dynamics.
Setting the effective contact rate (β) to 3.2, the relative increased susceptibility of the more susceptible group (σ) to 10, other famine-related parameters to their null values, and all remaining parameters to their midpoint values with no famine end time, we explore the dynamical effect of certain combinations of famine-related parameters on TB dynamics. For both graphs, curve 1 shows the TB mortality curve with no famine-related changes in parameters. (A) A three-fold increase in the background mortality (δμ = 3) rate leads to a decrease in the number of TB mortalities since death due to non-TB causes depletes those at-risk for TB death (curve 2). A three-fold decrease in immunity conferred by latency (δζ = 0.3) results in more TB mortalities since more individuals become infected (curve 3). However, a three-fold increase in the background mortality rate in combination with a three-fold decrease in immunity conferred by latency results in a minimal change to the TB mortality curve (curve 4). (B) A 25% increase in the probability of fast-progression (δp = 1.25) leads to an increase in the model-predicted number of TB mortalities during the first few years of the epidemic (curve 2). However, somewhat paradoxically, higher TB death rates do not necessarily lead to increased TB mortality at population-level. This is due to the fact that with lower TB death rates individuals with TB are infectious for more time and thus are able to infect more individuals, ultimately leading to a greater number of TB deaths in the population. With a two-fold increase in the TB death rate (δ(μTB) = 2), we see fewer TB mortalities (curve 3). However, a two-fold increase in the TB death rate in combination with a 25% increase in the probability of fast progression results in a minimal change to the TB mortality curve (curve 4).

Similar articles

Cited by

References

    1. Abel L, El-Baghdadi J, Bousfiha AA, Casanova J-L, Schurr E. Human genetics of tuberculosis: a long and winding road. Philosophical Transactions of the Royal Society of London. Series B, Biological Sciences. 2014;369:20130428. doi: 10.1098/rstb.2013.0428. - DOI - PMC - PubMed
    1. Aparicio JP, Castillo-Chavez C. Mathematical modelling of tuberculosis epidemics. Mathematical Biosciences and Engineering: MBE. 2009;6:209–237. doi: 10.3934/mbe.2009.6.209. - DOI - PubMed
    1. Baltimore RS. Tuberculosis: a comprehensive international approach. The Yale Journal of Biology and Medicine. 1993;66:335–336.
    1. Baxter T. Low infectivity of tuberculosis. Lancet. 1993;342(8867):371. doi: 10.1016/0140-6736(93)91516-O. - DOI - PubMed
    1. Blower SM, McLean AR, Porco TC, Small PM, Hopewell PC, Sanchez MA, Moss AR. The intrinsic transmission dynamics of tuberculosis epidemics. Nature Medicine. 1995;1:815–821. doi: 10.1038/nm0895-815. - DOI - PubMed