

High mitochondrial mass identifies a sub-population of stem-like cancer cells that are chemo-resistant
- PMID: 26421710
- PMCID: PMC4741545
- DOI: 10.18632/oncotarget.5401
High mitochondrial mass identifies a sub-population of stem-like cancer cells that are chemo-resistant
Abstract
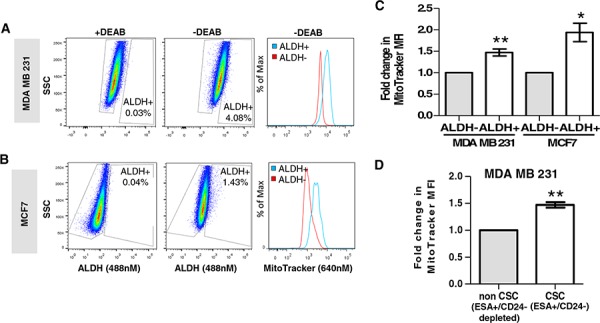
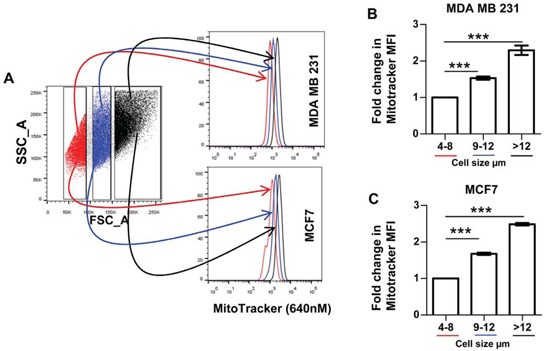
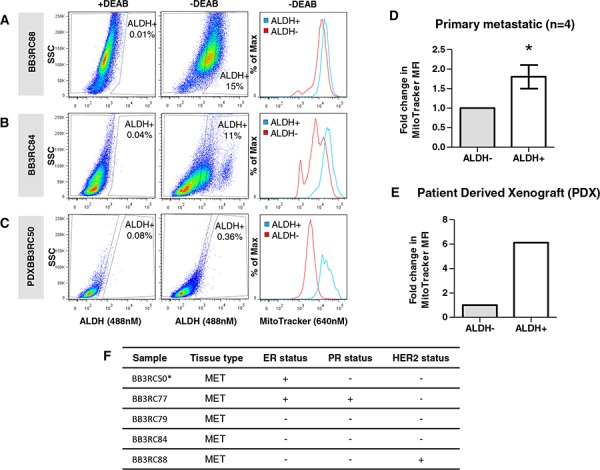
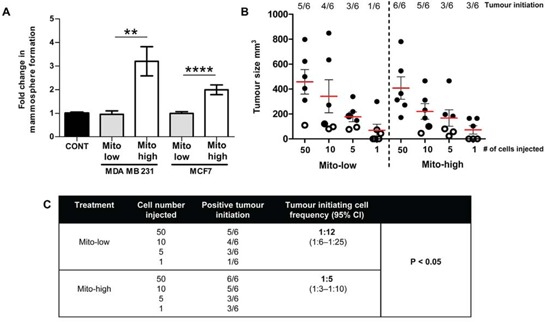
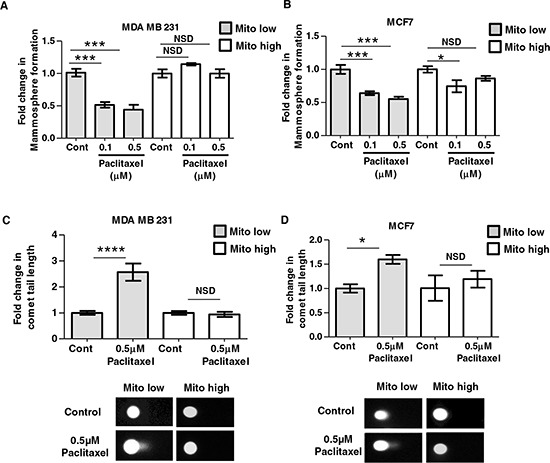
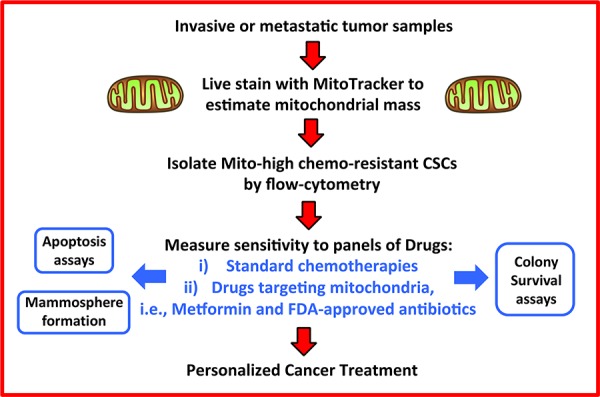
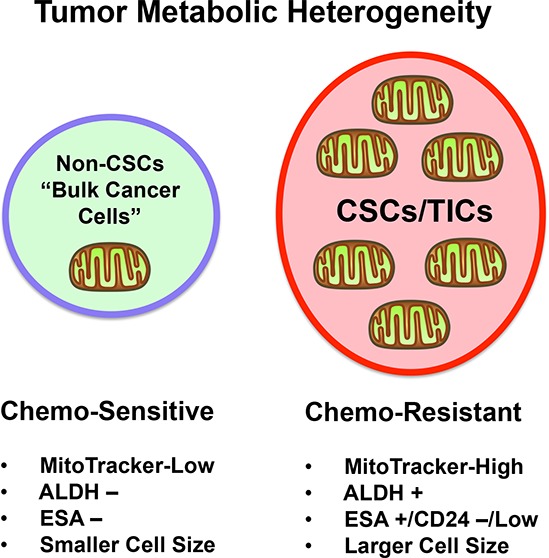
Chemo-resistance is a clinical barrier to more effective anti-cancer therapy. In this context, cancer stem-like cells (CSCs) are thought to be chemo-resistant, resulting in tumor recurrence and distant metastasis. Our hypothesis is that chemo-resistance in CSCs is driven, in part, by enhanced mitochondrial function. Here, we used breast cell lines and metastatic breast cancer patient samples to begin to dissect the role of mitochondrial metabolism in conferring the CSC phenotype. More specifically, we employed fluorescent staining with MitoTracker (MT) to metabolically fractionate these cell lines into mito-high and mito-low sub-populations, by flow-cytometry. Interestingly, cells with high mitochondrial mass (mito-high) were specifically enriched in a number of known CSC markers, such as aldehyde dehydrogenase (ALDH) activity, and they were ESA+/CD24-/low and formed mammospheres with higher efficiency. Large cell size is another independent characteristic of the stem cell phenotype; here, we observed a >2-fold increase in mitochondrial mass in large cells (>12-μm), relative to the smaller cell population (4-8-μm). Moreover, the mito-high cell population showed a 2.4-fold enrichment in tumor-initiating cell activity, based on limiting dilution assays in murine xenografts. Importantly, primary human breast CSCs isolated from patients with metastatic breast cancer or a patient derived xenograft (PDX) also showed the co-enrichment of ALDH activity and mitochondrial mass. Most significantly, our investigations demonstrated that mito-high cells were resistant to paclitaxel, resulting in little or no DNA damage, as measured using the comet assay. In summary, increased mitochondrial mass in a sub-population of breast cancer cells confers a stem-like phenotype and chemo-resistance. As such, our current findings have important clinical implications for over-coming drug resistance, by therapeutically targeting the mito-high CSC population.
Keywords: MitoTracker; cancer stem cells; mitochondria; tumor metabolism.
Conflict of interest statement
None.
Figures
Comment in
-
Mitochondrial mass and DNA repair in breast cancer stem cells.Oncotarget. 2015 Nov 17;6(36):38442-3. doi: 10.18632/oncotarget.6305. Oncotarget. 2015. PMID: 26564961 Free PMC article. No abstract available.
Similar articles
-
Dissecting tumor metabolic heterogeneity: Telomerase and large cell size metabolically define a sub-population of stem-like, mitochondrial-rich, cancer cells.Oncotarget. 2015 Sep 8;6(26):21892-905. doi: 10.18632/oncotarget.5260. Oncotarget. 2015. PMID: 26323205 Free PMC article.
-
ShRNA targeting Notch1 sensitizes breast cancer stem cell to paclitaxel.Int J Biochem Cell Biol. 2013 Jun;45(6):1064-73. doi: 10.1016/j.biocel.2013.02.022. Epub 2013 Mar 14. Int J Biochem Cell Biol. 2013. PMID: 23500524
-
Mitochondrial mass, a new metabolic biomarker for stem-like cancer cells: Understanding WNT/FGF-driven anabolic signaling.Oncotarget. 2015 Oct 13;6(31):30453-71. doi: 10.18632/oncotarget.5852. Oncotarget. 2015. PMID: 26421711 Free PMC article.
-
The role of aldehyde dehydrogenase (ALDH) in cancer drug resistance.Biomed Pharmacother. 2013 Sep;67(7):669-80. doi: 10.1016/j.biopha.2013.04.005. Epub 2013 May 9. Biomed Pharmacother. 2013. PMID: 23721823 Review.
-
Cancer stem cells and their implication in breast cancer.Eur J Clin Invest. 2014 Jul;44(7):678-87. doi: 10.1111/eci.12276. Epub 2014 May 22. Eur J Clin Invest. 2014. PMID: 24766664 Review.
Cited by
-
Phyto-Immunotherapy, a Complementary Therapeutic Option to Decrease Metastasis and Attack Breast Cancer Stem Cells.Front Oncol. 2020 Aug 7;10:1334. doi: 10.3389/fonc.2020.01334. eCollection 2020. Front Oncol. 2020. PMID: 32850424 Free PMC article. Review.
-
Increased MALAT1 expression contributes to cisplatin resistance in non-small cell lung cancer.Oncol Lett. 2018 Oct;16(4):4821-4828. doi: 10.3892/ol.2018.9293. Epub 2018 Aug 10. Oncol Lett. 2018. PMID: 30250547 Free PMC article.
-
Chronic Exposure to Chewing Tobacco Induces Metabolic Reprogramming and Cancer Stem Cell-Like Properties in Esophageal Epithelial Cells.Cells. 2019 Aug 21;8(9):949. doi: 10.3390/cells8090949. Cells. 2019. PMID: 31438645 Free PMC article.
-
AG311, a small molecule inhibitor of complex I and hypoxia-induced HIF-1α stabilization.Cancer Lett. 2017 Mar 1;388:149-157. doi: 10.1016/j.canlet.2016.11.040. Epub 2016 Dec 8. Cancer Lett. 2017. PMID: 27939695 Free PMC article.
-
Prevalence of somatic mitochondrial mutations and spatial distribution of mitochondria in non-small cell lung cancer.Br J Cancer. 2017 Jul 11;117(2):220-226. doi: 10.1038/bjc.2017.155. Epub 2017 May 30. Br J Cancer. 2017. PMID: 28557978 Free PMC article.
References
-
- Zhang M, Rosen JM. Stem cells in the etiology and treatment of cancer. Current opinion in genetics & development. 2006;16:60–64. - PubMed
-
- Li X, Lewis MT, Huang J, Gutierrez C, Osborne CK, Wu MF, Hilsenbeck SG, Pavlick A, Zhang X, Chamness GC, Wong H, Rosen J, Chang JC. Intrinsic resistance of tumorigenic breast cancer cells to chemotherapy. Journal of the National Cancer Institute. 2008;100:672–679. - PubMed
-
- Scopelliti A, Cammareri P, Catalano V, Saladino V, Todaro M, Stassi G. Therapeutic implications of Cancer Initiating Cells. Expert opinion on biological therapy. 2009;9:1005–1016. - PubMed
-
- Xin H, Kong Y, Jiang X, Wang K, Qin X, Miao ZH, Zhu Y, Tan W. Multi-drug-resistant cells enriched from chronic myeloid leukemia cells by Doxorubicin possess tumor-initiating-cell properties. Journal of pharmacological sciences. 2013;122:299–304. - PubMed
Publication types
MeSH terms
Substances
LinkOut - more resources
Full Text Sources
Other Literature Sources
Medical
Research Materials
