. 2015 Sep 30;10(9):e0137993.
doi: 10.1371/journal.pone.0137993. eCollection 2015.

Agent-Based Model Forecasts Aging of the Population of People Who Inject Drugs in Metropolitan Chicago and Changing Prevalence of Hepatitis C Infections

Affiliations

Agent-Based Model Forecasts Aging of the Population of People Who Inject Drugs in Metropolitan Chicago and Changing Prevalence of Hepatitis C Infections

Alexander Gutfraind et al. PLoS One. .

Abstract

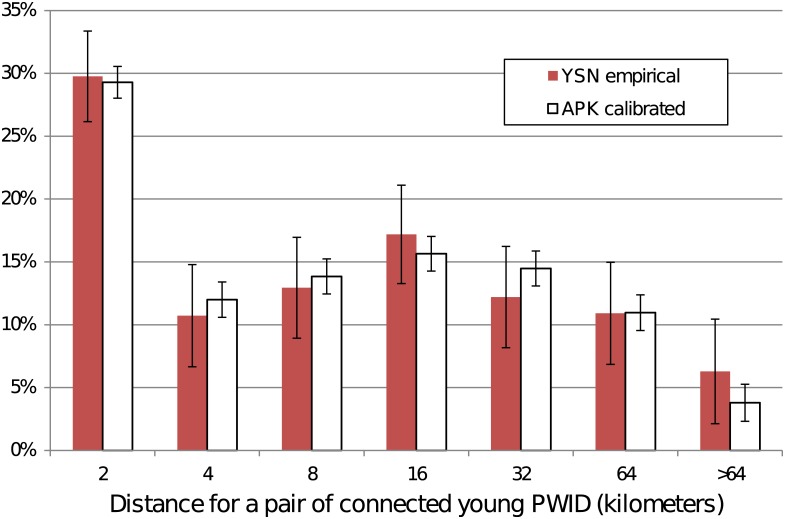
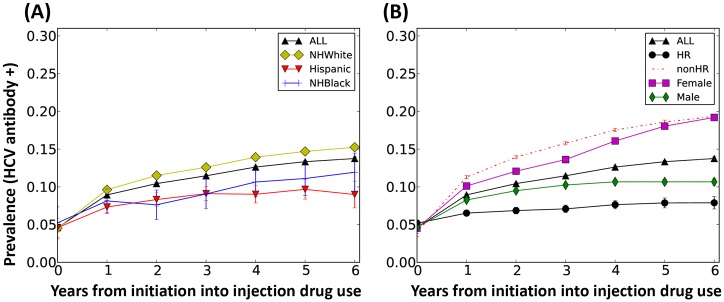
People who inject drugs (PWID) are at high risk for blood-borne pathogens transmitted during the sharing of contaminated injection equipment, particularly hepatitis C virus (HCV). HCV prevalence is influenced by a complex interplay of drug-use behaviors, social networks, and geography, as well as the availability of interventions, such as needle exchange programs. To adequately address this complexity in HCV epidemic forecasting, we have developed a computational model, the Agent-based Pathogen Kinetics model (APK). APK simulates the PWID population in metropolitan Chicago, including the social interactions that result in HCV infection. We used multiple empirical data sources on Chicago PWID to build a spatial distribution of an in silico PWID population and modeled networks among the PWID by considering the geography of the city and its suburbs. APK was validated against 2012 empirical data (the latest available) and shown to agree with network and epidemiological surveys to within 1%. For the period 2010-2020, APK forecasts a decline in HCV prevalence of 0.8% per year from 44(± 2)% to 36(± 5)%, although some sub-populations would continue to have relatively high prevalence, including Non-Hispanic Blacks, 48(± 5)%. The rate of decline will be lowest in Non-Hispanic Whites and we find, in a reversal of historical trends, that incidence among non-Hispanic Whites would exceed incidence among Non-Hispanic Blacks (0.66 per 100 per years vs 0.17 per 100 person years). APK also forecasts an increase in PWID mean age from 35(± 1) to 40(± 2) with a corresponding increase from 59(± 2)% to 80(± 6)% in the proportion of the population >30 years old. Our studies highlight the importance of analyzing subpopulations in disease predictions, the utility of computer simulation for analyzing demographic and health trends among PWID and serve as a tool for guiding intervention and prevention strategies in Chicago, and other major cities.


Conflict of interest statement

Competing Interests: The authors have declared that no competing interests exist.

Figures

Fig 1
Fig 1. Schematic representation of APK design.
The empirical data is represented by five main datasets. The incorporation of each dataset in the development of APK is shown by arrows. The locations of specific data outputs in the form of Tables and Figures are shown in Red type. CNEP: Community Outreach Intervention Projects (COIP) Needle Exchange Program (NEP); NHBS: National HIV Behavioral Surveillance; YSN: Young Social Networks; CNEP+: Enhanced CNEP population generated for APK.
Fig 2
Fig 2. APK screen showing the Chicago metropolitan area.
The screen shows people who inject drugs (PWID, small squares), geographic zones (gray regions) and relationships (straight black lines). PWID are colored based on their hepatitis C status: Red—HCV- Infected, Blue—naïve, and Green—HCV-recovered. For clarity, this simulation displays just 320 agents, 1% of the entire APK PWID population. Orange circles—major drug markets.
Fig 3
Fig 3. Stages in the progression of infection with HCV.
The duration of each stage is indicated (if temporary) together with the probability of transition to another state of HCV infection. Probabilities are shown as representative values (details in Table 1).
Fig 4
Fig 4. Comparison of APK predictions for 2012 with the NHBS empirical survey data from 2012.
APK correctly forecasts the prevalence overall and in 11 of 11 subgroups with substantially different prevalence values (average error in estimate: 2.0%). Error bars represent one standard deviation. NHWhite = Non-Hispanic White; HR = Individuals in Harm Reduction Programs; nonHR = Individuals not in Harm Reduction Programs; LEQ30 = PWID aged 30 or younger; Over30 = PWID over 30 years of age; City = PWID within the City of Chicago; Suburban = PWID living in Chicago suburbs.
Fig 5
Fig 5. Distances in the drug-sharing network of among young PWID (age 30 or younger).
The data shows the results for APK compared to empirical data from the Young Social Network (YSN) dataset. Error bars represent one standard deviation.
Fig 6
Fig 6. Age and Composition of the PWID population from 2010–2020.
(A) Composition of PWID from 2010–2020 based on location, Suburban and City, and age, persons over and under 30 years of age. (B) Detailed distribution of PWID over time within different age groups <20; 21–30; 31–40; 41–50 and 51–60 years of age, (C) Composition of PWID population within racial groups (NH Black, Hispanic and NH White) and within HR and non-HR groups, In all figures trends show average of 300 simulations and errors represent one standard deviation between simulations. HR = PWID in harm reduction programs, non-HR = PWID not enrolled in harm reduction programs.
Fig 7
Fig 7. Forecast of HCV antibody prevalence in Chicago over a 10-year span, 2010–2020.
(A) HCV antibody prevalence based on location, Suburban and City, and age, persons over and under 30 years of age. (B) Prevalence within the total population, individual racial groups (NH White; NH Black and Hispanic) and HR and non-HR groups. (C) Prevalence within the total population and based on gender. Trends show average of 300 simulations and error bars represent one standard deviation. HR = PWID in harm reduction programs, non-HR = PWID not enrolled in harm reduction programs.
Fig 8
Fig 8. Incidence of HCV among PWID in metropolitan Chicago.
(A) Incidence density by group and geographic area summed over 2010–2019. (B) Total incidence of HCV by year. Values are expressed as HCV incidence per 100 PY and have an estimated uncertainty of ±20%. HR = Individuals in Harm Reduction Programs; nonHR = Individuals not in Harm Reduction Programs. Network = Individuals having at least one incoming connections in the PWID network.
Fig 9
Fig 9. Timing of HCV infections over the duration of the injection career, among PWID who become infected.
The horizontal axis indicates months from the beginning of injecting drug use. Each bar represents a 4 month period.
Fig 10
Fig 10. The prevalence of HCV over the injecting career among PWID who initiate into injection drug use.
(A) Prevalence within the total population and within individual racial/ethnic groups, NH White, Hispanic, NH Black. (B) Prevalence within the total population and divided for gender and harm reduction (HR) enrollment. Time is counted from the beginning of an individual’s initiation into stable injection drug use (and APK), and assumes 5% incidence due to experimental use of Heroin before transition to stable injection use. The curves represent the combined injection careers of all PWID who initiated over 2010–2020. Data is shown as the mean of 300 simulations and the error bars represent one standard deviation.

Similar articles

Cited by

References

    1. WHO. World Health Organization. Hepatitis C Fact Sheet No 164. 2015 Available: http://www.who.int/mediacentre/factsheets/fs164/en/.
    1. CDC. Centers for Disease Control and Prevention. HCV statistics. 2014 Available: http://www.cdc.gov/hepatitis/HCV/StatisticsHCV.htm.
    1. El-Serag HB. Epidemiology of viral hepatitis and hepatocellular carcinoma. Gastroenterology. 2012;142(6): 1264–73e1. 10.1053/j.gastro.2011.12.061 . - DOI - PMC - PubMed
    1. Ly KN, Xing J, Klevens RM, Jiles RB, Ward JW, Holmberg SD. The increasing burden of mortality from viral hepatitis in the United States between 1999 and 2007. Annals of Internal Medicine. 2012;156(4): 271–8. 10.7326/0003-4819-156-4-201202210-00004 . - DOI - PubMed
    1. Kane A, Lloyd J, Zaffran M, Simonsen L, Kane M. Transmission of hepatitis B, hepatitis C and human immunodeficiency viruses through unsafe injections in the developing world: model-based regional estimates. Bulletin of the World Health Organization. 1999;77(10): 801–7. . - PMC - PubMed

Publication types

MeSH terms