

A Magnetic Bead-Based Sensor for the Quantification of Multiple Prostate Cancer Biomarkers
- PMID: 26421725
- PMCID: PMC4589536
- DOI: 10.1371/journal.pone.0139484
A Magnetic Bead-Based Sensor for the Quantification of Multiple Prostate Cancer Biomarkers
Abstract
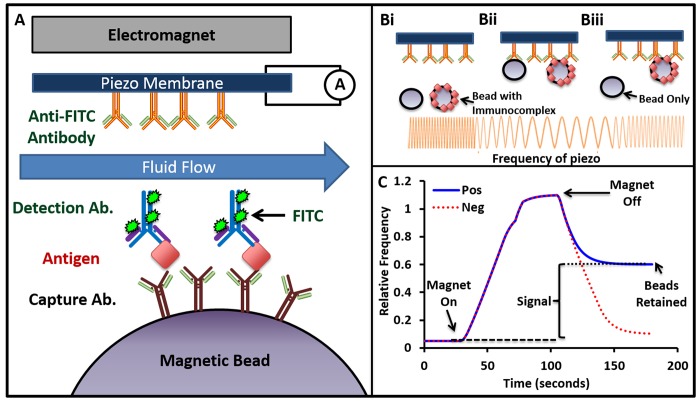
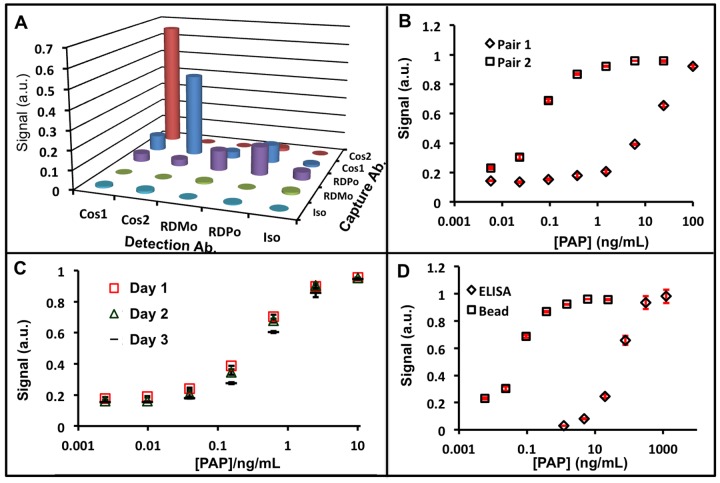
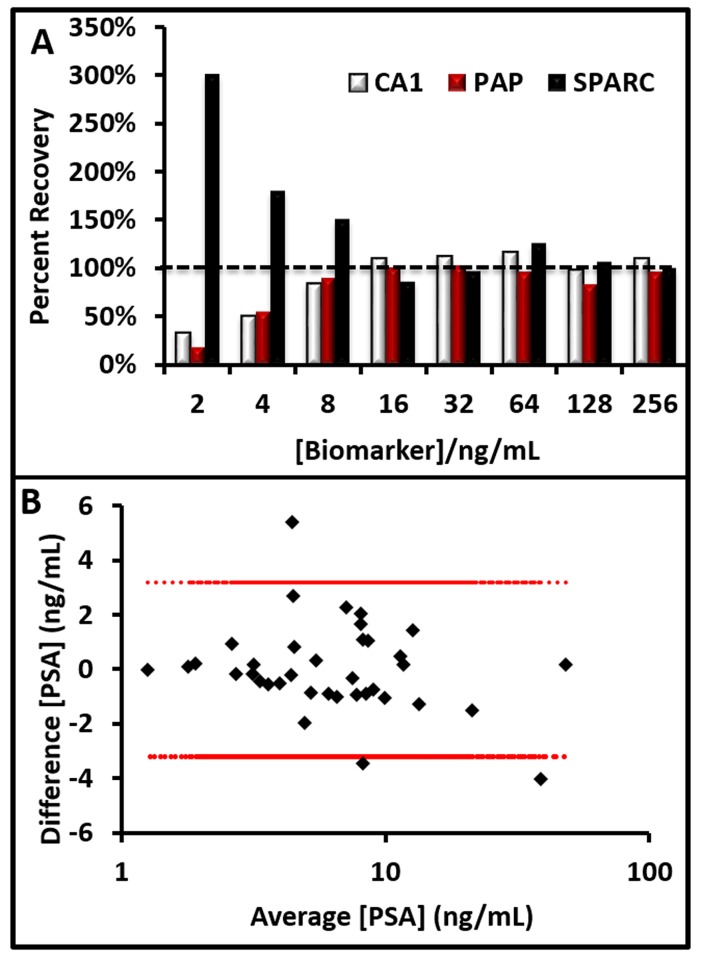
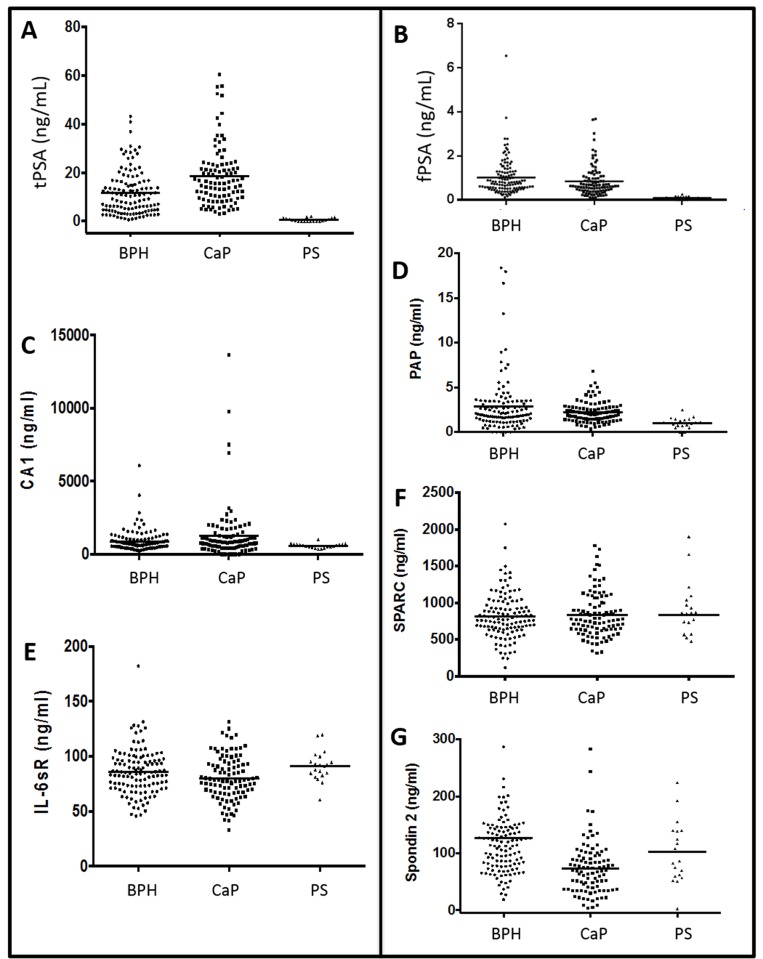
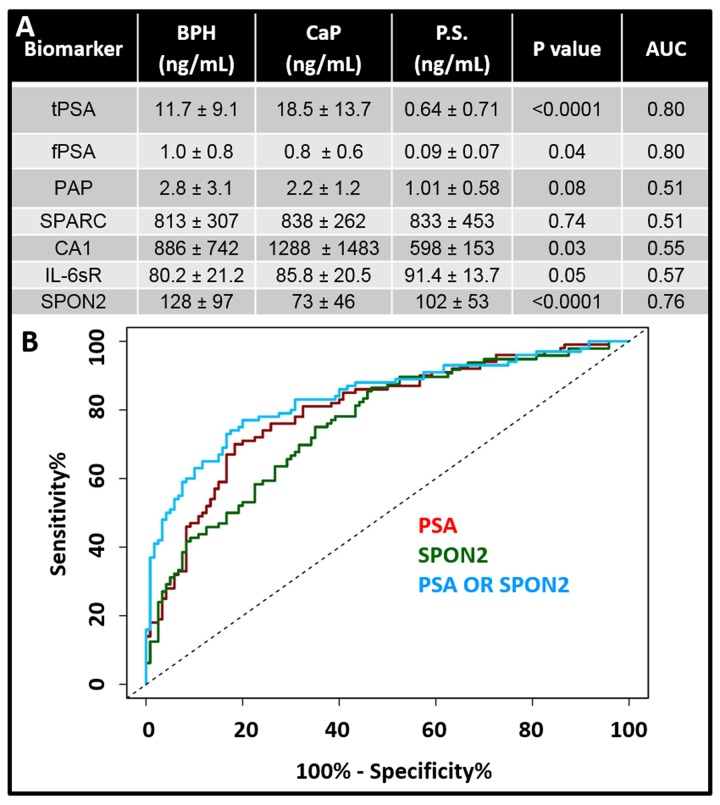
Novel biomarker assays and upgraded analytical tools are urgently needed to accurately discriminate benign prostatic hypertrophy (BPH) from prostate cancer (CaP). To address this unmet clinical need, we report a piezeoelectric/magnetic bead-based assay to quantitate prostate specific antigen (PSA; free and total), prostatic acid phosphatase, carbonic anhydrase 1 (CA1), osteonectin, IL-6 soluble receptor (IL-6sr), and spondin-2. We used the sensor to measure these seven proteins in serum samples from 120 benign prostate hypertrophy patients and 100 Gleason score 6 and 7 CaP using serum samples previously collected and banked. The results were analyzed with receiver operator characteristic curve analysis. There were significant differences between BPH and CaP patients in the PSA, CA1, and spondin-2 assays. The highest AUC discrimination was achieved with a spondin-2 OR free/total PSA operation--the area under the curve was 0.84 with a p value below 10(-6). Some of these data seem to contradict previous reports and highlight the importance of sample selection and proper assay building in the development of biomarker measurement schemes. This bead-based system offers important advantages in assay building including low cost, high throughput, and rapid identification of an optimal matched antibody pair.
Conflict of interest statement
Figures
Similar articles
-
Investigation on core-fucosylated prostate-specific antigen as a refined biomarker for differentiation of benign prostate hyperplasia and prostate cancer of different aggressiveness.Tumour Biol. 2019 Mar;41(3):1010428319827223. doi: 10.1177/1010428319827223. Tumour Biol. 2019. PMID: 30907281
-
Prostate-specific antigen: insufficient discrimination between benign prostatic hyperplasia and organ-confined prostate cancer.Urol Int. 1996;57(3):170-4. doi: 10.1159/000282904. Urol Int. 1996. PMID: 8912446
-
[Improved discrimination between prostatic carcinoma and benign prostatic hyperplasia by determination of free prostate-specific antigen percentage].Urologe A. 1997 May;36(3):255-8. doi: 10.1007/s001200050100. Urologe A. 1997. PMID: 9265347 German.
-
Tumor markers. Consensus Conference on Diagnosis and Prognostic Parameters in Localized Prostate Cancer. Stockholm, Sweden, May 12-13, 1993.Scand J Urol Nephrol Suppl. 1994;162:73-87; discussion 115-27. Scand J Urol Nephrol Suppl. 1994. PMID: 7529430 Review.
-
Molecular forms of serum prostate-specific antigen: the clinical usefulness of percent free PSA to discriminate prostate cancer from BPH.Hinyokika Kiyo. 1998 Apr;44(4):223-32. Hinyokika Kiyo. 1998. PMID: 9617617 Review.
Cited by
-
Flavin Binding Allosteric Aptamer with Noncovalent Labeling for miR Sensing.Bioconjug Chem. 2019 Nov 20;30(11):2822-2827. doi: 10.1021/acs.bioconjchem.9b00561. Epub 2019 Oct 9. Bioconjug Chem. 2019. PMID: 31557001 Free PMC article.
-
Multifunctional nanomedicine with silica: Role of silica in nanoparticles for theranostic, imaging, and drug monitoring.J Colloid Interface Sci. 2018 Jul 1;521:261-279. doi: 10.1016/j.jcis.2018.02.053. Epub 2018 Feb 20. J Colloid Interface Sci. 2018. PMID: 29510868 Free PMC article. Review.
-
Nanomaterial-based biosensors for detection of prostate specific antigen.Mikrochim Acta. 2017 Jul 14;184(9):3049-3067. doi: 10.1007/s00604-017-2410-1. Mikrochim Acta. 2017. PMID: 29109592 Free PMC article. Review.
-
Biomarkers That Differentiate Benign Prostatic Hyperplasia from Prostate Cancer: A Literature Review.Cancer Manag Res. 2020 Jul 1;12:5225-5241. doi: 10.2147/CMAR.S250829. eCollection 2020. Cancer Manag Res. 2020. PMID: 32669872 Free PMC article. Review.
-
Improved detection of prostate cancer using a magneto-nanosensor assay for serum circulating autoantibodies.PLoS One. 2019 Aug 12;14(8):e0221051. doi: 10.1371/journal.pone.0221051. eCollection 2019. PLoS One. 2019. PMID: 31404106 Free PMC article. Clinical Trial.
References
-
- Jokerst JV, Raamanathan A, Christodoulides N, Floriano PN, Pollard AA, Simmons GW, et al. Nano-bio-chips for high performance multiplexed protein detection: determinations of cancer biomarkers in serum and saliva using quantum dot bioconjugate labels. Biosens Bioelectron. 2009;24(12):3622–9. 10.1016/j.bios.2009.05.026 - DOI - PMC - PubMed
Publication types
MeSH terms
Substances
Grants and funding
LinkOut - more resources
Full Text Sources
Other Literature Sources
Medical
Research Materials
Miscellaneous
