Comparative Study
. 2016 May 15;79(10):840-849.
doi: 10.1016/j.biopsych.2015.08.009. Epub 2015 Aug 18.

Neuroanatomic Differences Associated With Stress Susceptibility and Resilience

Affiliations
Comparative Study

Neuroanatomic Differences Associated With Stress Susceptibility and Resilience

Christoph Anacker et al. Biol Psychiatry. .

Abstract

Background: We examined the neurobiological mechanisms underlying stress susceptibility using structural magnetic resonance imaging and diffusion tensor imaging to determine neuroanatomic differences between stress-susceptible and resilient mice. We also examined synchronized anatomic differences between brain regions to gain insight into the plasticity of neural networks underlying stress susceptibility.

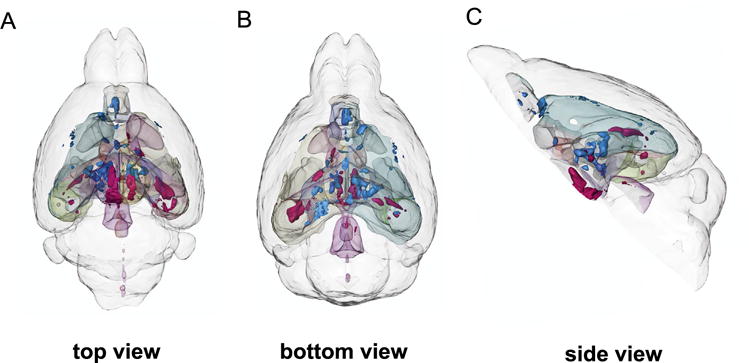
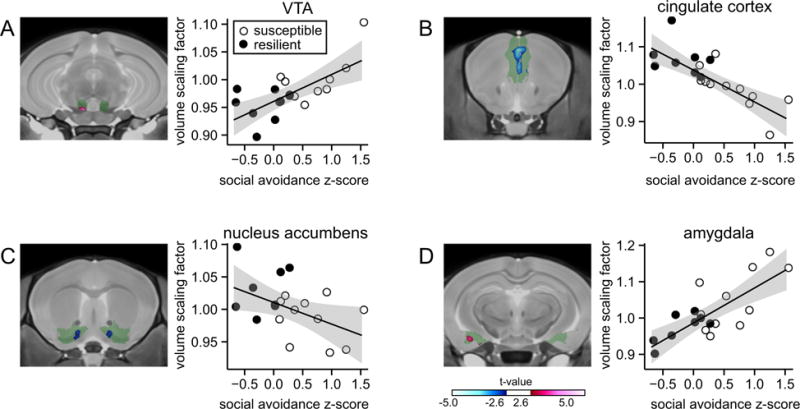
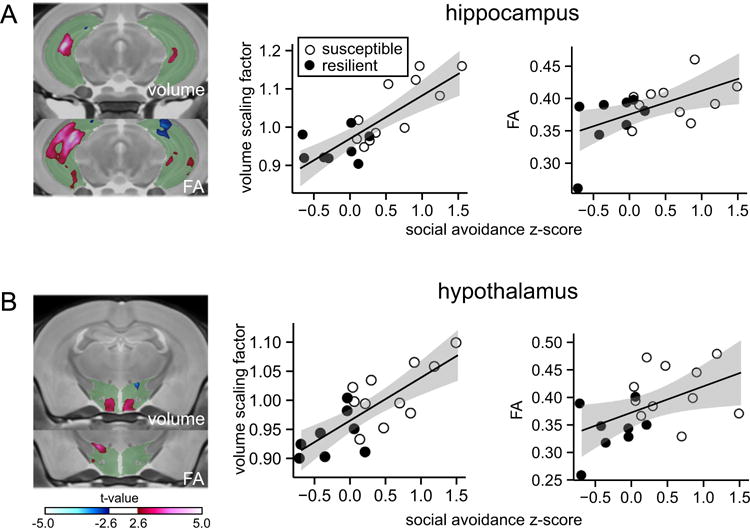
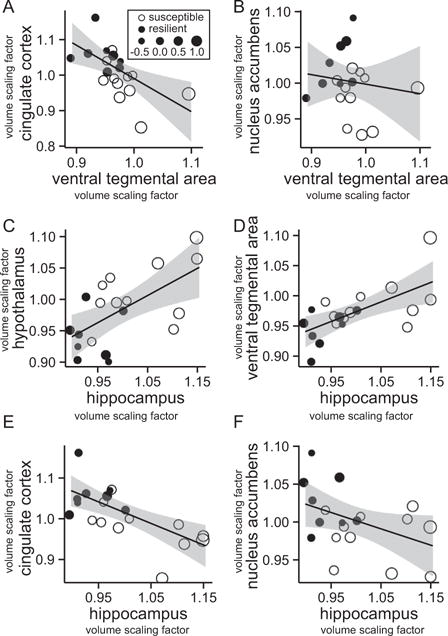
Methods: C57BL/6 mice underwent 10 days of social defeat stress and were subsequently tested for social avoidance. For magnetic resonance imaging, brains of stressed (susceptible, n = 11; resilient, n = 8) and control (n = 12) mice were imaged ex vivo at 56 µm resolution using a T2-weighted sequence. We tested for behavior-structure correlations by regressing social avoidance z-scores against local brain volume. For diffusion tensor imaging, brains were scanned with a diffusion-weighted fast spin echo sequence at 78 μm isotropic voxels. Structural covariance was assessed by correlating local volume between brain regions.

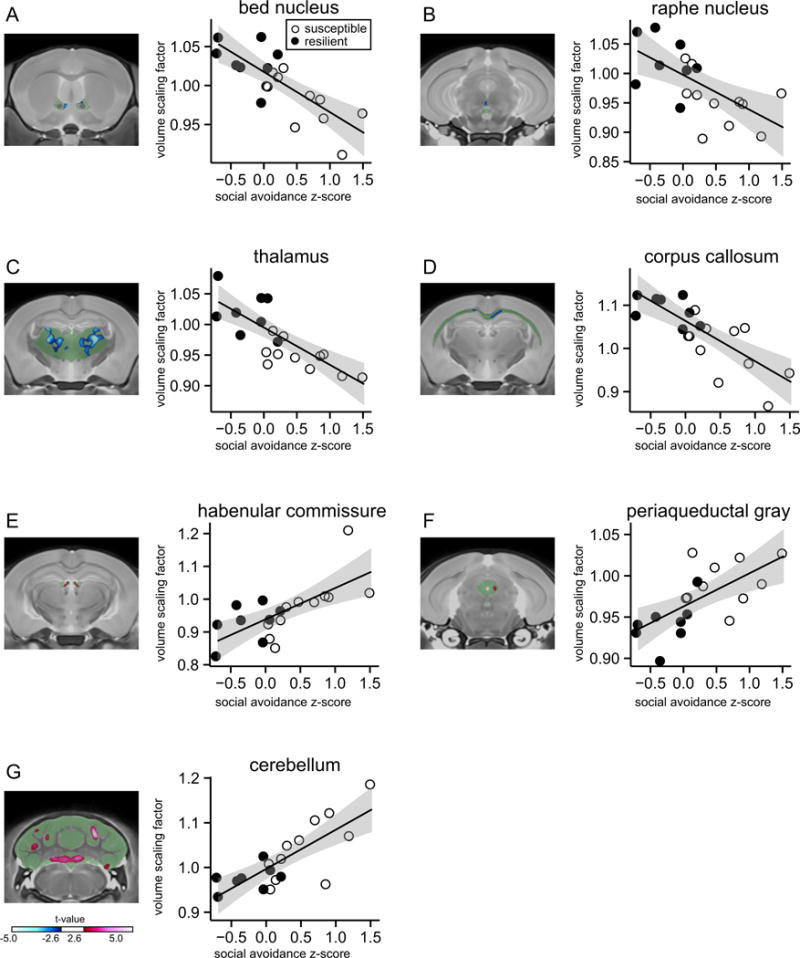
Results: Social avoidance correlated negatively with local volume of the cingulate cortex, nucleus accumbens, thalamus, raphe nuclei, and bed nucleus of the stria terminals. Social avoidance correlated positively with volume of the ventral tegmental area (VTA), habenula, periaqueductal gray, cerebellum, hypothalamus, and hippocampal CA3. Fractional anisotropy was increased in the hypothalamus and hippocampal CA3. We observed synchronized anatomic differences between the VTA and cingulate cortex, hippocampus and VTA, hippocampus and cingulate cortex, and hippocampus and hypothalamus. These correlations revealed different structural covariance between brain regions in susceptible and resilient mice.

Conclusions: Stress-integrative brain regions shape the neural architecture underlying individual differences in susceptibility and resilience to chronic stress.

Keywords: Chronic stress; Cingulate cortex; DTI; Depression; Hippocampus; MRI; Neural circuits; Ventral tegmental area.


Conflict of interest statement

The authors report no biomedical financial interests or potential conflicts of interest.

Figures

Figure 1
Figure 1
Three-dimensional rendering of all significant volume changes after chronic social defeat stress in 19 mice. Red clusters indicate positive correlations with social avoidance, and blue clusters indicate negative correlations with social avoidance. (A) Top view. (B) Bottom view. (C) Side view.
Figure 2
Figure 2
Correlations between social avoidance and volumes of previously established stress-related brain structures. Social avoidance z scores are correlated with anatomic volume at the most significant voxel within selected brain structures. (A) Positive correlation with ventral tegmental area (VTA). (B) Negative correlation with cingulate cortex. (C) Negative correlation with nucleus accumbens. (D) Positive correlation with amygdala. Green areas indicate the entire brain structure; blue and red areas indicate regions with significant volume changes. Open circles indicate susceptible mice (n = 11) and solid circles indicate resilient mice (n = 8) based on social interaction ratio.
Figure 3
Figure 3
Correlations between social avoidance, hippocampus and hypothalamus volume, and fractional anisotropy (FA). Social avoidance z scores are correlated with anatomic volume and FA at the most significant voxel within selected brain structures. (A) Positive correlation with hippocampal volume and FA. (B) Positive correlation with hypothalamus volume and FA. Green areas indicate the entire brain structure; blue and red areas indicate regions with significant volume changes. Open circles indicate susceptible mice (n = 11) and solid circles indicate resilient mice (n = 8) based on social interaction ratio.
Figure 4
Figure 4
Structural covariance between candidate brain regions. Peak voxel volume correlations are shown for (A) ventral tegmental area and cingulate cortex, (B) ventral tegmental area and nucleus accumbens, (C) hippocampus and hypothalamus, (D) hippocampus and ventral tegmental area, (E) hippocampus and cingulate cortex, and (F) hippocampus and nucleus accumbens. Open circles indicate susceptible mice (n = 11) and solid circles indicate resilient mice (n = 8) based on social interaction ratio. Circle sizes correspond to the social avoidance score of the respective animal.
Figure 5
Figure 5
Correlations between social avoidance and volumes of structures not previously associated with social defeat stress. Social avoidance z scores are correlated with anatomic volume at the most significant voxel. (A) Negative correlation with the bed nucleus of the stria terminals, (B) negative correlation with raphe nucleus, (C) negative correlation with thalamus, (D) negative correlation with corpus callosum, (E) positive correlation with habenular commissure, (F) positive correlation with periaqueductal gray, and (G) positive correlation with the cerebellum. Green areas indicate the entire brain structure; blue and red areas indicate regions with significant volume changes. Open circles indicate susceptible mice (n = 11) and solid circles indicate resilient mice (n = 8) based on social interaction ratio.

Comment in

References

    1. Kessler RC. The effects of stressful life events on depression. Annu Rev Psychol. 1997;48:191–214. - PubMed
    1. Hermans EJ, van Marle HJ, Ossewaarde L, Henckens MJ, Qin S, van Kesteren MT, et al. Stress-related noradrenergic activity prompts large-scale neural network reconfiguration. Science. 2011;334:1151–1153. - PubMed
    1. Jankord R, Herman JP. Limbic regulation of hypothalamo-pituitary-adrenocortical function during acute and chronic stress. Ann N Y Acad Sci. 2008;1148:64–73. - PMC - PubMed
    1. Chaudhury D, Walsh JJ, Friedman AK, Juarez B, Ku SM, Koo JW, et al. Rapid regulation of depression-related behaviours by control of midbrain dopamine neurons. Nature. 2013;493:532–536. - PMC - PubMed
    1. Amico F, Meisenzahl E, Koutsouleris N, Reiser M, Moller HJ, Frodl T. Structural MRI correlates for vulnerability and resilience to major depressive disorder. J Psychiatry Neurosci. 2010;36:15–22. - PMC - PubMed

Publication types