. 2015 Nov;13(9):547-57.
doi: 10.1089/adt.2015.661. Epub 2015 Sep 30.

A Versatile Cell Death Screening Assay Using Dye-Stained Cells and Multivariate Image Analysis

Affiliations

A Versatile Cell Death Screening Assay Using Dye-Stained Cells and Multivariate Image Analysis

Tony J Collins et al. Assay Drug Dev Technol. 2015 Nov.

Abstract

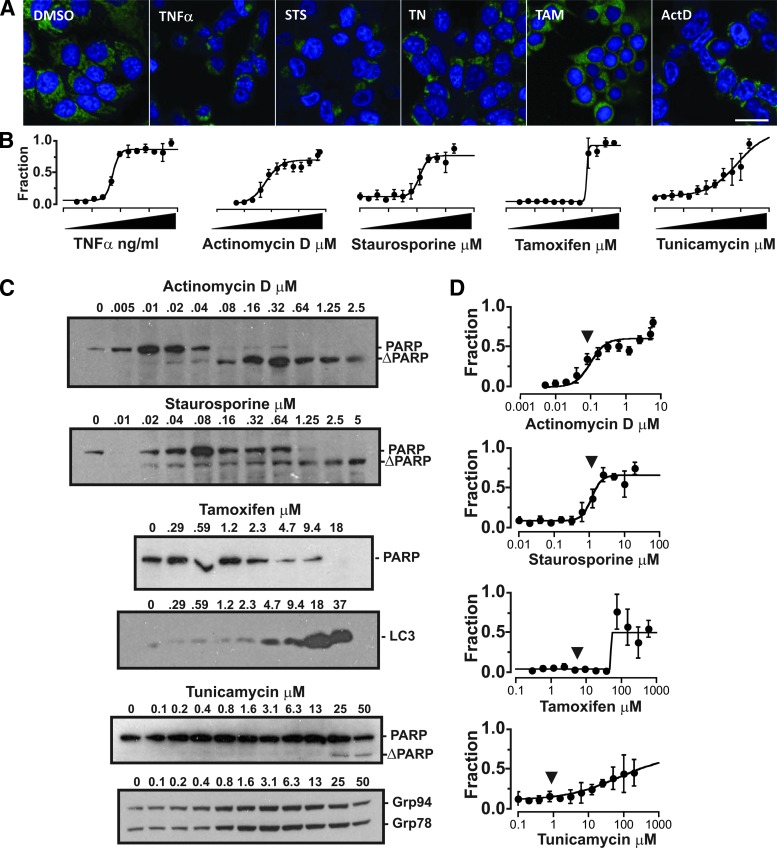
A novel dye-based method for measuring cell death in image-based screens is presented. Unlike conventional high- and medium-throughput cell death assays that measure only one form of cell death accurately, using multivariate analysis of micrographs of cells stained with the inexpensive mix, red dye nonyl acridine orange, and a nuclear stain, it was possible to quantify cell death induced by a variety of different agonists even without a positive control. Surprisingly, using a single known cytotoxic agent as a positive control for training a multivariate classifier allowed accurate quantification of cytotoxicity for mechanistically unrelated compounds enabling generation of dose-response curves. Comparison with low throughput biochemical methods suggested that cell death was accurately distinguished from cell stress induced by low concentrations of the bioactive compounds Tunicamycin and Brefeldin A. High-throughput image-based format analyses of more than 300 kinase inhibitors correctly identified 11 as cytotoxic with only 1 false positive. The simplicity and robustness of this dye-based assay makes it particularly suited to live cell screening for toxic compounds.


Figures

<b>Fig. 1.</b>
Fig. 1.
Image-based cell death assays. Example images of cells 24 h after TNFα treatment by the fluorescence assays under evaluation. For each assay, the relevant channels were merged, pseudocolored, and adjusted for brightness and contrast. (A) Cells stained with propidium iodide (PI, red), Annexin V Alexa Fluor 488 (AnnV, green), and DRAQ5 (blue). (B) Cells stained with tetramethylrhodamine, ethyl ester (TMRE; red), and DRAQ5 (blue). (C) Intensity weighted ratio images of cells expressing the caspase sensor showing monomeric Cerulean (mCer; cyan) and stimulated emission of Venus (Venus, yellow). (D) Cells stained with nonyl acridine orange (NAO; green) and DRAQ5 (blue). Scale bar = 20 μm.
<b>Fig. 2.</b>
Fig. 2.
Cell death measurements using conventional image-based assays are not as sensitive as MVA-NAO and immunoblotting. (A–F) Histograms illustrating the response of cells to the negative control (C) with no addition, dimethylsulfoxide (DMSO), or TNFα (1, 3, 10, 30, 100 ng/mL), thapsigargin (TG; 30, 90, 300, 900 nM, 3 μM), brefeldin A (BFA; 1, 3, 10, 30, 100 μg/mL), and dithiothreitol (DTT; .1, .3, 1, 3, 10 mM) measured using the indicated assay. The fraction of cells scored as affected using an arbitrary threshold for conventional image-based methods of quantifying apoptosis, including (A) Annexin V, (B) PI and cell number (blue), (C) TMRE, and (D) caspase activity compared to (E) MVA-NAO for a range of proapoptotic treatments. Bars indicated with * were significantly different than the negative controls (t-test, P < 0.05, n = 4). (F–G) Immunoblots for poly-ADP ribose polymerase (PARP) indicate apoptosis as cleavage of PARP to ΔPARP (migration positions indicated to the right of the blots) or necrosis as degradation of PARP (loss of both bands), (F) quantified after correction for actin levels measured from the same blots.
<b>Fig. 3.</b>
Fig. 3.
Cell death dose–response curves generated for cytotoxic compounds by MVA-NAO are comparable to those obtained by immunoblotting. (A) Example images of cells 24 h after drug treatment. Merged, pseudocolored images of NAO (green) and DRAQ5 (blue) were adjusted for brightness and contrast. Panels show cells with no treatment (DMSO) or with 150 ng/mL TNFα, 5 μM STS, 50 μM TN, 150 μM TAM, and 2.5 μM ActD. Scale bar = 20 μm. (B) Dose–response curves generated by MVA-NAO for TNFα (0.2–500 ng/mL), the cytotoxic drugs actinomycin D and staurosporine, and agents that cause autophagy (tamoxifen) or endoplasmic reticulum stress (tunicamycin). Increasing dose is indicated by the triangle, range is indicated in (D). Images of cells treated with DMSO and the highest dose of each drug were used to generate a classifier for that drug. Each point represents the average and standard deviation in fraction of cells/well classified as affected by the drug of eight replicate wells. (C) Detection of cell death, autophagy, and endoplasmic reticulum stress by immunoblotting cell lysates for PARP, light chain 3 (LC3), glucose regulated protein (Grp) 94, and Grp78 (bands are indicated to the right of the blots). Cleavage of PARP to ΔPARP indicates apoptosis, while degradation of PARP and ΔPARP indicates necrosis. Detection of the activated (cleaved and lipidated) form of LC3 indicates autophagy. Increased amounts of the abundant KDEL containing proteins Grp94 and Grp78 indicate endoplasmic reticulum stress. (D) Dose–response curves generated by MVA-NAO for the indicated drugs. Images randomly selected from the DMSO control and the highest dose TNFα were used to generate a classifier that was applied to images obtained for cells treated with the other drugs. Each point represents the average and standard deviation in fraction of cells/well classified as affected by the drug of eight wells. The downward arrow indicates the dose at which a change in phenotype was detected by immunoblotting.
<b>Fig. 4.</b>
Fig. 4.
Cytotoxic kinase inhibitors identified by MVA-NAO screening. MVA-NAO heat map where the color indicates the fraction of cells per well classified as affected (similar to TNFα treated), as indicated to the right of the panel. Columns of control wells containing cells treated with either TNFα or DMSO (pink or blue, respectively) are indicated below the panel.

References

    1. Galluzzi L, Bravo-San Pedro JM, Vitale I, et al. : Essential versus accessory aspects of cell death: recommendations of the NCCD 2015. Cell Death Differ 2015;22:58–73 - PMC - PubMed
    1. Kepp O, Galluzzi L, Lipinski M, Yuan J, Kroemer G: Cell death assays for drug discovery. Nat Rev Drug Discov 2011;10:221–237 - PubMed
    1. Klionsky DJ, Abdalla FC, Abeliovich H, et al. : Guidelines for the use and interpretation of assays for monitoring autophagy. Autophagy 2012;8:445–544 - PMC - PubMed
    1. Caie PD, Walls RE, Ingleston-Orme A, et al. : High-content phenotypic profiling of drug response signatures across distinct cancer cells. Mol Cancer Ther 2010;9:1913–1926 - PubMed
    1. Gustafsdottir SM, Ljosa V, Sokolnicki KL, et al. : Multiplex cytological profiling assay to measure diverse cellular states. PLoS One 2013;8:e80999. - PMC - PubMed

Publication types

MeSH terms

LinkOut - more resources