. 2016 Feb;183(2):206-20.
doi: 10.1111/cei.12716. Epub 2015 Nov 13.

The impact of HLA class I and EBV latency-II antigen-specific CD8(+) T cells on the pathogenesis of EBV(+) Hodgkin lymphoma

Affiliations

The impact of HLA class I and EBV latency-II antigen-specific CD8(+) T cells on the pathogenesis of EBV(+) Hodgkin lymphoma

K Jones et al. Clin Exp Immunol. 2016 Feb.

Abstract

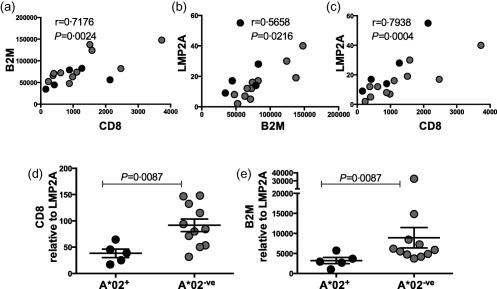
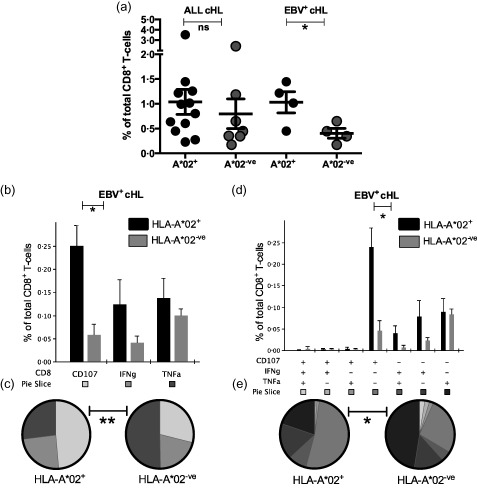
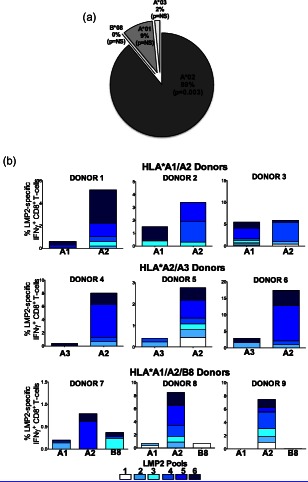
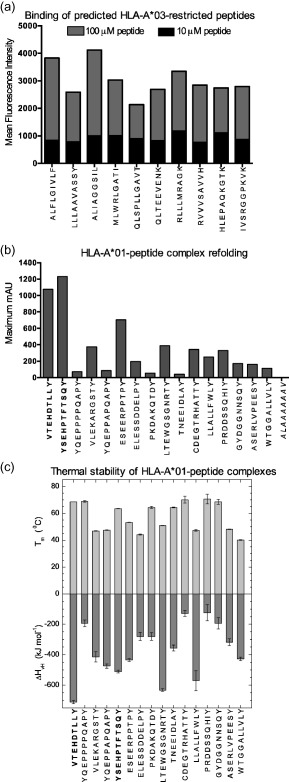
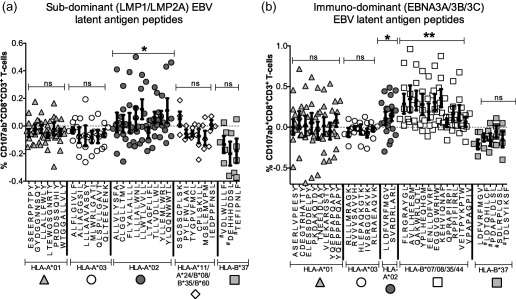
In 40% of cases of classical Hodgkin lymphoma (cHL), Epstein-Barr virus (EBV) latency-II antigens [EBV nuclear antigen 1 (EBNA1)/latent membrane protein (LMP)1/LMP2A] are present (EBV(+) cHL) in the malignant cells and antigen presentation is intact. Previous studies have shown consistently that HLA-A*02 is protective in EBV(+) cHL, yet its role in disease pathogenesis is unknown. To explore the basis for this observation, gene expression was assessed in 33 cHL nodes. Interestingly, CD8 and LMP2A expression were correlated strongly and, for a given LMP2A level, CD8 was elevated markedly in HLA-A*02(-) versus HLA-A*02(+) EBV(+) cHL patients, suggesting that LMP2A-specific CD8(+) T cell anti-tumoral immunity may be relatively ineffective in HLA-A*02(-) EBV(+) cHL. To ascertain the impact of HLA class I on EBV latency antigen-specific immunodominance, we used a stepwise functional T cell approach. In newly diagnosed EBV(+) cHL, the magnitude of ex-vivo LMP1/2A-specific CD8(+) T cell responses was elevated in HLA-A*02(+) patients. Furthermore, in a controlled in-vitro assay, LMP2A-specific CD8(+) T cells from healthy HLA-A*02 heterozygotes expanded to a greater extent with HLA-A*02-restricted compared to non-HLA-A*02-restricted cell lines. In an extensive analysis of HLA class I-restricted immunity, immunodominant EBNA3A/3B/3C-specific CD8(+) T cell responses were stimulated by numerous HLA class I molecules, whereas the subdominant LMP1/2A-specific responses were confined largely to HLA-A*02. Our results demonstrate that HLA-A*02 mediates a modest, but none the less stronger, EBV-specific CD8(+) T cell response than non-HLA-A*02 alleles, an effect confined to EBV latency-II antigens. Thus, the protective effect of HLA-A*02 against EBV(+) cHL is not a surrogate association, but reflects the impact of HLA class I on EBV latency-II antigen-specific CD8(+) T cell hierarchies.

Keywords: Epstein-Barr virus; HLA class I; T cell immunity; classical Hodgkin lymphoma; genetic associations.


Figures

Figure 1
Figure 1
Gene expression in Epstein–Barr virus (EBV)+ classical Hodgkin lymphoma (cHL) diseased tissue. (a) Correlation of beta 2‐microglobulin (β2M) and CD8 expression levels. (b) Correlation of latent membrane protein (LMP)2A and β2M expression levels. (c) Correlation of LMP2A and CD8 expression levels. Spearman's correlation = r. (d) CD8 expression relative to LMP2A in human leucocyte antigen (HLA)‐A*02+ compared to HLA‐A*02 patients. (e) β2M expression relative to LMP2A in HLA‐A*02+ compared to HLA‐A*02 patients. Error bar represents standard error of the mean. Solid black circles represent HLA‐A*02+ patients. Grey circles represent HLA‐A*02 patients.
Figure 2
Figure 2
Ex‐vivo Epstein–Barr virus (EBV)‐specific CD8+ T‐cell responses in patients with classical Hodgkin lymphoma (cHL) . (a) Summed percentages of ex‐vivo latent membrane protein (LMP)1/2A‐specific CD8+ T cell responses defined by interferon (IFN)‐γ, tumour necrosis factor (TNF)‐α and CD107a. Error bars represent standard error of the mean. P‐values were calculated using a linear mixed effects model. (b–c) Comparison of individual effector molecules in human leucocyte antigen (HLA)‐A*02+ versus HLA‐A*02‐ve patients with EBV+cHL. (b) Percentage of total CD8+ T cells specific for LMP1/2A. (c) Percentage of the total LMP1/2A‐specific CD8+ T cell subset. (d–e) Comparison of polyfunctional LMP1/2A‐specific CD8+ T cell responses in HLA‐A*02+ versus HLA‐A*02‐ve patients with EBV+cHL. (d) Percentage of total CD8+ T cells specific for LMP1/2A. (e) Percentage of the total LMP1/2A‐specific CD8+ T cell subset. **P < 0·01; *P < 0·05; P > 0·05 = not significant.
Figure 3
Figure 3
Human leucocyte antigen (HLA) class I‐restricted expansion of latent membrane protein (LMP)2A‐specific interferon (IFN) γ+CD8+ T cells. (a) Percentages of total HLA class I‐restricted LMP2A‐specific CD8+ T cell responses generated in vitro from healthy Epstein–Barr virus (EBV) seropositive HLA‐A*02 heterozygotes (n = 9). Only HLA‐A*02‐restricted responses were significantly above zero. (b) The combined expansion of LMP2A‐specific IFN‐γ+CD8+ T‐cells is shown for all donors from the three HLA‐A*02 heterozygote combinations. Each bar depicts the percentage of LMP2A‐specific IFN‐γ+CD8+ T cells expanded from one of the six peptide pools. The peptide pools are described in Supporting information, Table S2.
Figure 4
Figure 4
Human leucocyte antigen (HLA) class I peptide binding assays for algorithm‐predicted peptides. (a) HLA‐A*03 binding of predicted peptides was confirmed using a T2 cell line transfected with HLA‐A*03. Peptides were added at concentrations of 10 μM or 100 μM, and HLA class I expression was measured by flow cytometry analysis using an αHLA‐A*03 antibody. Data are shown as the mean fluorescence intensity above the negative control. (b) HLA‐A*01 binding of predicted peptides was confirmed by in‐vitro refolding. Maximum mAU values are shown. Positive control peptides are in shown in bold type. The negative control peptide is shown in italics. (c) Thermal stability with respect to melting temperature (upper panel) and van't Hoff's enthalpy of unfolding (lower panel). Error bars represent standard error of the respective parameter based on fitting each set of measured data. Positive control peptides are shown in bold type.
Figure 5
Figure 5
Hierarchy of ex‐vivo human leucocyte antigen (HLA) class I‐restricted CD8+ T cell responses to known and predicted peptides derived from latent membrane protein (LMP)1/LMP2A and EBNA3A/3B/3C. The ex‐vivo CD107ab+CD8+ T cell responses to individual peptides are shown. Complete epitope sequences are listed together with the restricting allotypes; further details are shown in Supporting information, Table S3. Error bars represent standard error of the mean. #Predicted HLA‐B*37‐restricted peptides with unconfirmed binding. (a) Subdominant LMP1/LMP2A‐derived epitope‐specific responses. (b) Immunodominant EBNA3A/3B/3C‐derived epitope‐specific responses. The P‐values indicate significance of combined peptide responses above zero: **P < 0·01; *P < 0·05; P > 0·05 = not significant.

References

    1. Young L, Alfieri C, Hennessy K et al Expression of Epstein–Barr virus transformation‐associated genes in tissues of patients with EBV lymphoproliferative disease. N Engl J Med 1989; 321:1080–5. - PubMed
    1. Deacon EM, Pallesen G, Niedobitek G et al Epstein–Barr virus and Hodgkin's disease: transcriptional analysis of virus latency in the malignant cells. J Exp Med 1993; 177:339–49. - PMC - PubMed
    1. Gandhi MK, Tellam JT, Khanna R. Epstein–Barr virus‐associated Hodgkin's lymphoma. Br J Haematol 2004; 125:267–81. - PubMed
    1. Young LS, Rickinson AB. Epstein–Barr virus: 40 years on. Nat Rev Cancer 2004; 4:757–68. - PubMed
    1. Murray PG, Constandinou CM, Crocker J, Young LS, Ambinder RF. Analysis of major histocompatibility complex class I, TAP expression, and LMP2 epitope sequence in Epstein–Barr virus‐positive Hodgkin's disease. Blood 1998; 92:2477–83. - PubMed

Publication types

MeSH terms

Substances