. 2015 Sep 30;10(9):e0137786.
doi: 10.1371/journal.pone.0137786. eCollection 2015.

Human Polyclonal Antibodies Produced through DNA Vaccination of Transchromosomal Cattle Provide Mice with Post-Exposure Protection against Lethal Zaire and Sudan Ebolaviruses

Affiliations

Human Polyclonal Antibodies Produced through DNA Vaccination of Transchromosomal Cattle Provide Mice with Post-Exposure Protection against Lethal Zaire and Sudan Ebolaviruses

Callie E Bounds et al. PLoS One. .

Abstract

DNA vaccination of transchromosomal bovines (TcBs) with DNA vaccines expressing the codon-optimized (co) glycoprotein (GP) genes of Ebola virus (EBOV) and Sudan virus (SUDV) produce fully human polyclonal antibodies (pAbs) that recognize both viruses and demonstrate robust neutralizing activity. Each TcB was vaccinated by intramuscular electroporation (IM-EP) a total of four times and at each administration received 10 mg of the EBOV-GPco DNA vaccine and 10 mg of the SUDV-GPco DNA vaccine at two sites on the left and right sides, respectively. After two vaccinations, robust antibody responses (titers > 1000) were detected by ELISA against whole irradiated EBOV or SUDV and recombinant EBOV-GP or SUDV-GP (rGP) antigens, with higher titers observed for the rGP antigens. Strong, virus neutralizing antibody responses (titers >1000) were detected after three vaccinations when measured by vesicular stomatitis virus-based pseudovirion neutralization assay (PsVNA). Maximal neutralizing antibody responses were identified by traditional plaque reduction neutralization tests (PRNT) after four vaccinations. Neutralizing activity of human immunoglobulins (IgG) purified from TcB plasma collected after three vaccinations and injected intraperitoneally (IP) into mice at a 100 mg/kg dose was detected in the serum by PsVNA up to 14 days after administration. Passive transfer by IP injection of the purified IgG (100 mg/kg) to groups of BALB/c mice one day after IP challenge with mouse adapted (ma) EBOV resulted in 80% protection while all mice treated with non-specific pAbs succumbed. Similarly, interferon receptor 1 knockout (IFNAR(-/-)) mice receiving the purified IgG (100 mg/kg) by IP injection one day after IP challenge with wild type SUDV resulted in 89% survival. These results are the first to demonstrate that filovirus GP DNA vaccines administered to TcBs by IM-EP can elicit neutralizing antibodies that provide post-exposure protection. Additionally, these data describe production of fully human IgG in a large animal system, a system which is capable of producing large quantities of a clinical grade therapeutic product.


Conflict of interest statement

Competing Interests: EJS, HW, and JJ are employed at SAB Biotherapeutics, Inc. DH and BE are employed at Ichor Medical Systems, Inc. This does not alter the authors' adherence to PLOS ONE policies on sharing data and materials.

Figures

Fig 1
Fig 1. Production of human antibodies in TcBs.
(A) Timeline of the vaccinations (black arrows), blood collections (red arrows) and plasma collections (blue arrows) for the TcBs. Serum samples obtained from two TcBs (#2295 and #2303) before vaccination (week 0) or 8–10 days after vaccinations 2–4 with EBOV-GPco and SUDV-GPco DNA vaccines were analyzed for total IgG antibodies by ELISA using (B) whole irradiated EBOV or SUDV antigens, and (C) EBOV rGP or SUDV rGP. Symbols represent the titers at each time point for each TcB.
Fig 2
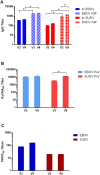
Fig 2. Purified pAbs from vaccinated TcBs demonstrate neutralizing activity against EBOV and SUDV.
Antibodies were purified from plasma collected from both TcBs eight days following the third and fourth vaccinations. (A) These purified V3 (22.16 mg/ml) and V4 (36.68 mg/ml) EBOV/SUDV human pAbs were evaluated by standard ELISA for total IgG antibody responses using whole-irradiated EBOV or SUDV antigen, and EBOV rGP or SUDV rGP antigen. (B) EBOV- and SUDV- neutralizing activity of the purified EBOV/SUDV human pAbs was determined by PsVNA, (C) and PRNT. Significant differences between titers are denoted by (*) where p < 0.05.
Fig 3
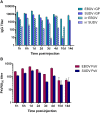
Fig 3. Bioavailability of purified EBOV/SUDV human pAbs in mice.
BALB/c mice (N = 10) received a single IP injection of 100 mg/kg of the purified V3 EBOV/SUDV human pAbs. (A) Sera collected from individual mice at the indicated time points after injection were analyzed by standard ELISA for total human IgG using whole-irradiated EBOV or SUDV antigen, and EBOV rGP or SUDV rGP antigen. (B) Serum samples were also evaluated for EBOV- and SUDV-neutralizing activity by PsVNA.
Fig 4
Fig 4. Weight loss and survival of BALB/c mice challenged with maEBOV when administered purified EBOV/SUDV human pAbs before or after challenge.
Groups of BALB/c mice (N = 10) received a single IP injection of PBS, 100mg/kg NS pAbs, or 100mg/kg EBOV/SUDV pAbs one day before, or one or two days after challenge with 1000 pfu of maEBOV by IP injection. (A) Mean weight was determined daily for each dosing group and graphed as the percent mean of the starting weight. (B) Kaplan-Meier survival curves indicating the percentage of surviving mice at each day of the 21-day post-challenge observation period are shown. Survival of mice receiving the NS pAbs compared to the EBOV/SUDV pAbs one day before challenge (p = 0.9573), NS pAbs vs EBOV/SUDV pAbs one day after challenge (p = 0.0449), and NS pAbs vs EBOV/SUDV pAbs two days after challenge (p = 0.5720). Significant differences between survival curves are denoted by (*) where p < 0.05.
Fig 5
Fig 5. Weight loss and survival of BALB/c mice administered high, medium, or low doses of purified EBOV/SUDV human pAbs after maEBOV challenge.
Groups of BALB/c mice (N = 10) received a single IP injection of 100mg/kg NS pAbs, 100 mg/kg EBOV/SUDV pAbs, 50 mg/kg EBOV/SUDV pAbs, or 10 mg/kg EBOV/SUDV pAbs one day after challenge or 50 mg/kg EBOV/SUDV pAbs, 25 mg/kg EBOV/SUDV pAbs, or 5 mg/kg EBOV/SUDV pAbs on day 1 and day 2 after challenge with 100 pfu maEBOV. (A) Mean weight was determined daily for each dosing group and graphed as the percent mean of the starting weight. All mice receiving the NS pabs succumb by day 8 post-challenge. (B) Kaplan-Meier survival curves indicating the percentage of surviving mice at each day of the 21-day post-challenge observation period are shown. The p-values for the following comparisons are as follows: 100 mg/kg NS pAbs vs. 100 mg/kg EBOV/SUDV pAbs +1 (p = 0.0003), 100 mg/kg NS pAbs vs. 50 mg/kg EBOV/SUDV pAbs +1 (p = 0.0059), NS pAbs vs. 10 mg/kg EBOV/SUDV pAbs +1 (p = 0.0630), NS pAbs vs. 50 mg/kg EBOV/SUDV pAbs +1 and +2 (p = 0.002), NS pAbs vs. 25 mg/kg EBOV/SUDV pAbs +1 and +2 (p = 0.0046), NS pAbs vs. 5mg/kg EBOV/SUDV pAbs +1 and +2 (p = 0.1082), 100mg/kg EBOV/SUDV pAbs +1 vs. 50 mg/kg EBOV/SUDV pAbs +1 and +2 (p = 0.1988), 50 mg/kg EBOV/SUDV +1 vs. 25 mg/kg EBOV/SUDV pAbs +1 and +2 (p = 0.9968), and 10 mg/kg EBOV/SUDV pAbs +1 vs. 5 mg/kg EBOV/SUDV pAbs +1 and +2 (p = 0.7275). Significant differences between survival curves are denoted by (*) where p < 0.05.
Fig 6
Fig 6. Weight loss and survival of IFNR -/- mice challenged with SUDV when administered purified EBOV/SUDV human pAbs after challenge.
Groups of IFNR -/- mice (N = 9) received a single IP injection of 100 mg/kg NS pAbs one day before, or 100 mg/kg EBOV/SUDV pAbs one day or two days after challenge via the IP route with 1000 pfu of SUDV. (A) Mean weight was determined daily for each dosing group and graphed as the percent mean of the starting weight. All mice in the NS pabs or the EBOV/SUDV pabs +2 groups succumb to disease by day 8 post-challenge. (B) Kaplan-Meier survival curves indicating the percentage of surviving mice at each day of the 19-day post-challenge observation period are shown. Survival of mice receiving the NS pAbs compared to the EBOV/SUDV pAbs one day after challenge (p = 0.0009), and NS pAbs versus EBOV/SUDV pAbs two days after challenge (p = 0.3981). Significant differences between survival curves are denoted by (*) where p < 0.05.

References

    1. Feldmann H, Jones S, Klenk HD, Schnittler HJ. Ebola virus: from discovery to vaccine. Nature reviews Immunology. 2003;3(8):677–85. - PubMed
    1. Feldmann H, Klenk HD. Filoviruses In: Baron S, editor. Medical Microbiology. 4th ed Galveston (TX) 1996. - PubMed
    1. Feldmann H, Slenczka W, Klenk HD. Emerging and reemerging of filoviruses. Archives of virology Supplementum. 1996;11:77–100. - PubMed
    1. Kuhn JH. Filoviruses. A compendium of 40 years of epidemiological, clinical, and laboratory studies. Archives of virology Supplementum. 2008;20:13–360. - PubMed
    1. Emond RT, Evans B, Bowen ET, Lloyd G. A case of Ebola virus infection. British medical journal. 1977;2(6086):541–4. - PMC - PubMed

Publication types

MeSH terms