. 2015 Nov 6;14(11):4752-62.
doi: 10.1021/acs.jproteome.5b00826. Epub 2015 Oct 22.

Advancing Urinary Protein Biomarker Discovery by Data-Independent Acquisition on a Quadrupole-Orbitrap Mass Spectrometer

Affiliations

Advancing Urinary Protein Biomarker Discovery by Data-Independent Acquisition on a Quadrupole-Orbitrap Mass Spectrometer

Jan Muntel et al. J Proteome Res. .

Abstract

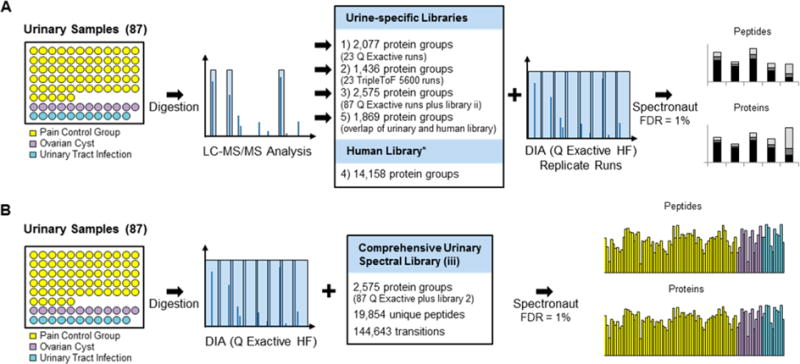
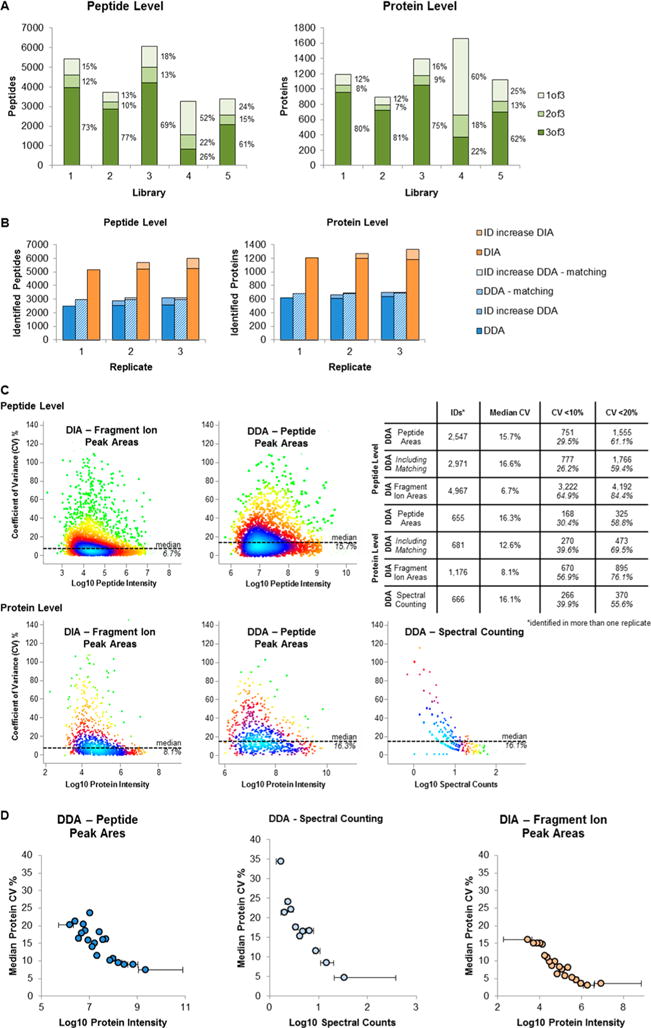
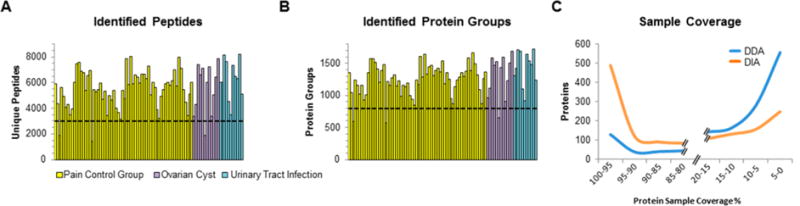
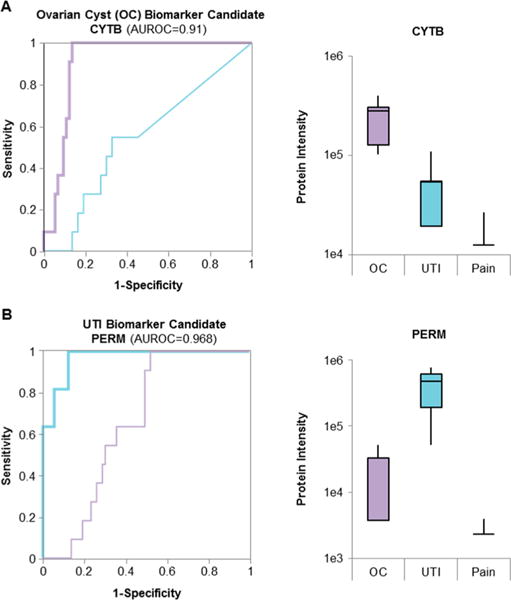
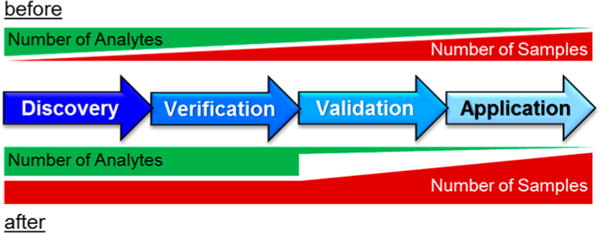
The promises of data-independent acquisition (DIA) strategies are a comprehensive and reproducible digital qualitative and quantitative record of the proteins present in a sample. We developed a fast and robust DIA method for comprehensive mapping of the urinary proteome that enables large scale urine proteomics studies. Compared to a data-dependent acquisition (DDA) experiments, our DIA assay doubled the number of identified peptides and proteins per sample at half the coefficients of variation observed for DDA data (DIA = ∼8%; DDA = ∼16%). We also tested different spectral libraries and their effects on overall protein and peptide identifications and their reproducibilities, which provided clear evidence that sample type-specific spectral libraries are preferred for reliable data analysis. To show applicability for biomarker discovery experiments, we analyzed a sample set of 87 urine samples from children seen in the emergency department with abdominal pain. The whole set was analyzed with high proteome coverage (∼1300 proteins/sample) in less than 4 days. The data set revealed excellent biomarker candidates for ovarian cyst and urinary tract infection. The improved throughput and quantitative performance of our optimized DIA workflow allow for the efficient simultaneous discovery and verification of biomarker candidates without the requirement for an early bias toward selected proteins.

Keywords: DIA; QE; biomarker discovery; spectral library; urine proteomics.


Conflict of interest statement

Notes The authors declare no competing financial interest.

Figures

Figure 1
Figure 1
Workflow. (A) Generation of spectral library. Eighty-seven urinary samples from kids with abdominal pain, diagnosed with ovarian cyst (purple, 11), urinary tract infection (blue, 11), as well as a pain control group (yellow) were processed in a 96-well plate format. Twenty-three randomly chosen samples were analyzed by LC–MS/MS on a Q Exactive (Thermo Scientific) and TripleToF 5600 mass spectrometer. The resulting data were searched with MaxQuant (FDR 1%), and a spectral library of each search result was generated in Spectronaut (libraries 1 and 2). Additionally, all remaining samples were run on the Q Exactive and combined with the other two libraries to create a comprehensive urinary library (library 3). Library 4 was a publically available spectral library from Rosenberg et al., and library 5 featured those proteins from this publicly available library, which were also identified in library 3. All libraries (Table 1) were used in Spectronaut to analyze the DIA data of an unrelated urinary sample, acquired three times on a Q Exactive HF mass spectrometer. (B) DIA sample acquisition. All 87 samples were analyzed by a 30 min LC gradient on a Q Exactive HF mass spectrometer in DIA mode. We applied the comprehensive urinary spectral library (library 3) to analyze the data in Spectronaut (1% FDR).
Figure 2
Figure 2
Validation of workflow. (A) Influence of spectral library. A urinary sample was analyzed in triplicate with a DIA method on a Q Exactive HF mass spectrometer using five different spectral libraries (overview in Table 1). Plotted are the total numbers of identified peptides and proteins; each bar is divided into peptides/proteins that were identified in three of three replicates (dark green), two of three (green), and one of three (light green) as well as the percentages. (B) Number of peptide and protein identifications in replicate runs. A urinary sample was analyzed three times by a DDA and DIA methods on a Q Exactive mass spectrometer and analyzed using the comprehensive urinary library (library 3). The DDA data were analyzed in MaxQuant with and without the ID matching. We plotted the number of identified peptides and proteins (DIA, orange; DDA without matching, blue; DDA with matching, blue/white stripes) as well as the increase in identifications with each of the replicates (DIA, light orange; DDA, light blue). (C) Quantification precision. An independent urine sample was analyzed in triplicate with a DDA and DIA method on a Q Exactive HF mass spectrometer. DDA were quantified in MaxQuant either based on peptide peak areas (DDA, peptide peak areas) or spectral counting (DDA, spectral counting). DIA data were quantified in Spectronaut (DIA, fragment ion peak areas). For both peak area based quantification methods, protein values were calculated by summation of the peptide peak areas. The %CV of the quantification was calculated, plotted against the peptide/protein intensity, and the point density was color coded (Perseus: light blue, highest density; green, lowest density). The table gives an overview of the quantified peptides/proteins as well of number of peptides/proteins with a %CV below 10% and 20%. (D) Protein %CV in relation to protein abundance. The quantified proteins have been binned according to their intensity into 20 bins. The median %CV of each bin was plotted for three quantification methods (right panel, based on peptide peak areas of DDA data; middle panel, spectral counting; left panel, based on fragment peak areas of DIA data). The horizontal bars show the protein intensity spread of each bin.
Figure 3
Figure 3
Overview of DIA data set. (A) Overview of peptide identification results. The bar charts (right and left panel) give an overview of the identified peptides/proteins in each of the 87 individual samples using a 30 min gradient on a Q Exactive HF mass spectrometer with a DIA method (yellow, pain control group; purple, ovarian cyst; blue, urinary tract infections). (B) Overview of peptide identification results. (C) Protein sample coverage. We calculated how many proteins were identified in more than 95% of the samples, in 90–95% of the samples, etc. for DIA and DDA data (orange, DIA data; blue, DDA data).
Figure 4
Figure 4
Biomarker candidates. The proteins with the largest area under the ROC (AUROC) were considered the best biomarker candidates. (A) The ROC of the best candidate for ovarian cyst (CYTB, purple) and UTI (PERM, blue) on the ovarian cyst cohort. Diagonal segments are produced by ties. Additionally, the figure shows the intensity of each protein in all conditions as a boxplot. (B) The ROC for CYTB (purple) and PERM (blue) on the UTI sample cohort as well as the protein intensity in all conditions as boxplot.
Figure 5
Figure 5
Advanced biomarker research scheme. In a conventional biomarker experiment, the biomarker discovery with high proteome coverage is performed on a small subset of samples (before). Toward the further verification and validation of the candidates, the number of samples is increased, whereas through the application of targeted methods, fewer and fewer analytes are monitored. Focusing on a small number of candidates in the verification phase can result in missed biomarkers. Our optimized DIA workflow enables to keep a high number of analytes throughout the whole discovery and verification phase, increasing the robustness of biomarker discovery in the future (after).

References

    1. Wu J, Chen YD, Gu W. Urinary proteomics as a novel tool for biomarker discovery in kidney diseases. J Zhejiang Univ Sci B. 2010;11:227–37. - PMC - PubMed
    2. Lopez-Giacoman S, Madero M. Biomarkers in chronic kidney disease from kidney function to kidney damage. World J Nephrol. 2015;4:57–73. - PMC - PubMed
    3. Pedroza-Diaz J, Rothlisberger S. Advances in urinary protein biomarkers for urogenital non-urogenital pathologies. Biochem Med (Zagreb) 2015;25:22–35. - PMC - PubMed
    4. Mischak H, Delles C, Vlahou A, Vanholder R. Proteomic biomarkers in kidney disease: issues in development implementation. Nat Rev Nephrol. 2015;11:221–32. - PubMed
    1. Kentsis A, Shulman A, Ahmed S, Brennan E, Monuteaux MC, Lee YH, Lipsett S, Paulo JA, Dedeoglu F, Fuhlbrigge R, Bachur R, Bradwin G, Arditi M, Sundel RP, Newburger JW, Steen H, Kim S. Urine proteomics for discovery of improved diagnostic markers of Kawasaki disease. EMBO molecular medicine. 2013;5:210–20. - PMC - PubMed
    1. Zimmerli LU, Schiffer E, Zurbig P, Good DM, Kellmann M, Mouls L, Pitt AR, Coon JJ, Schmieder RE, Peter KH, Mischak H, Kolch W, Delles C, Dominiczak AF. Urinary proteomic biomarkers in coronary artery disease. Mol Cell Proteomics. 2007;7:290–8. - PubMed
    1. Adeola HA, Soares NC, Paccez JD, Kaestner L, Blackburn JM, Zerbini LF. Discovery of novel candidate urinary protein biomarkers for prostate cancer in a multi-ethnic cohort of South African patients via label-free mass spectrometry. Proteomics: Clin Appl. 2015;9:597–609. - PubMed
    1. Kentsis A, Lin YY, Kurek K, Calicchio M, Wang YY, Monigatti F, Campagne F, Lee R, Horwitz B, Steen H, Bachur R. Discovery validation of urine markers of acute pediatric appendicitis using high-accuracy mass spectrometry. Annals of emergency medicine. 2010;55:62–70. - PMC - PubMed
    2. Kentsis A, Ahmed S, Kurek K, Brennan E, Bradwin G, Steen H, Bachur R. Detection diagnostic value of urine leucine-rich alpha-2-glycoprotein in children with suspected acute appendicitis. Annals of emergency medicine. 2012;60:78–83. - PMC - PubMed

Publication types

MeSH terms