. 2015 Oct 1:5:14562.
doi: 10.1038/srep14562.

Detailed classification of swimming paths in the Morris Water Maze: multiple strategies within one trial

Affiliations

Detailed classification of swimming paths in the Morris Water Maze: multiple strategies within one trial

Tiago V Gehring et al. Sci Rep. .

Abstract

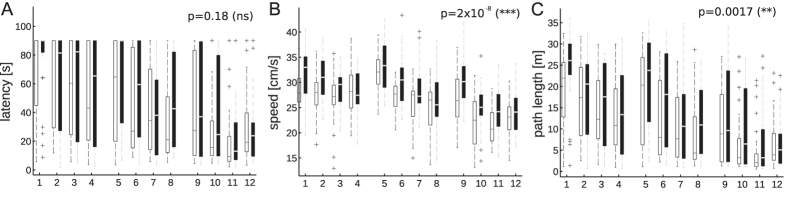
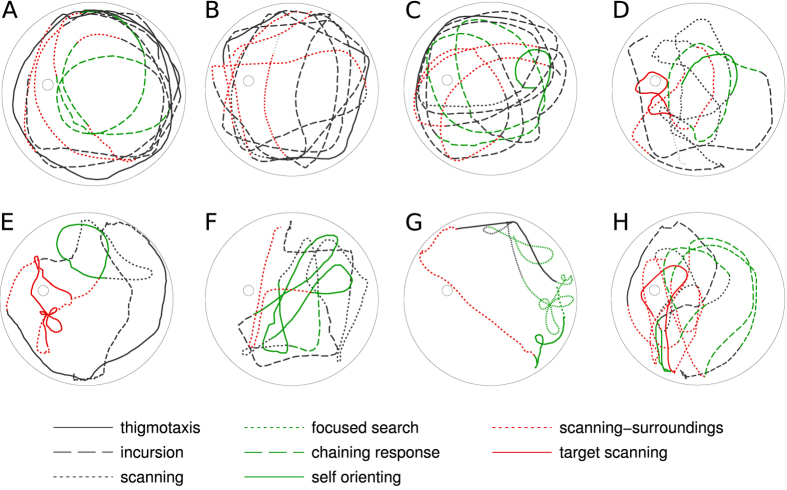
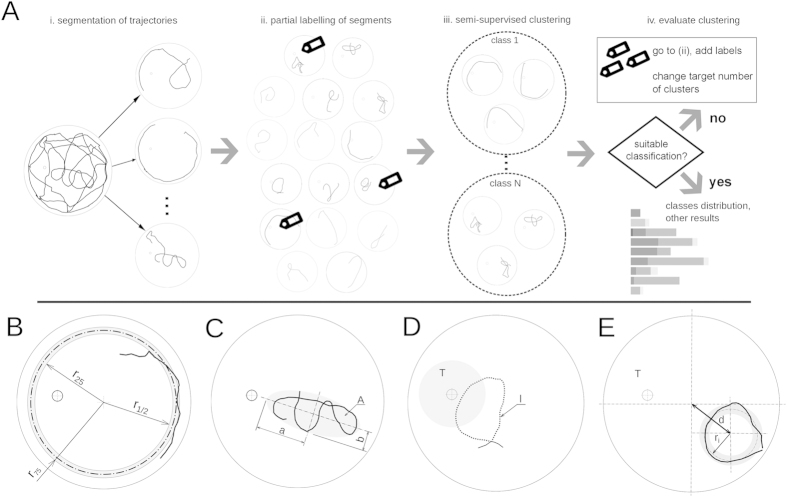
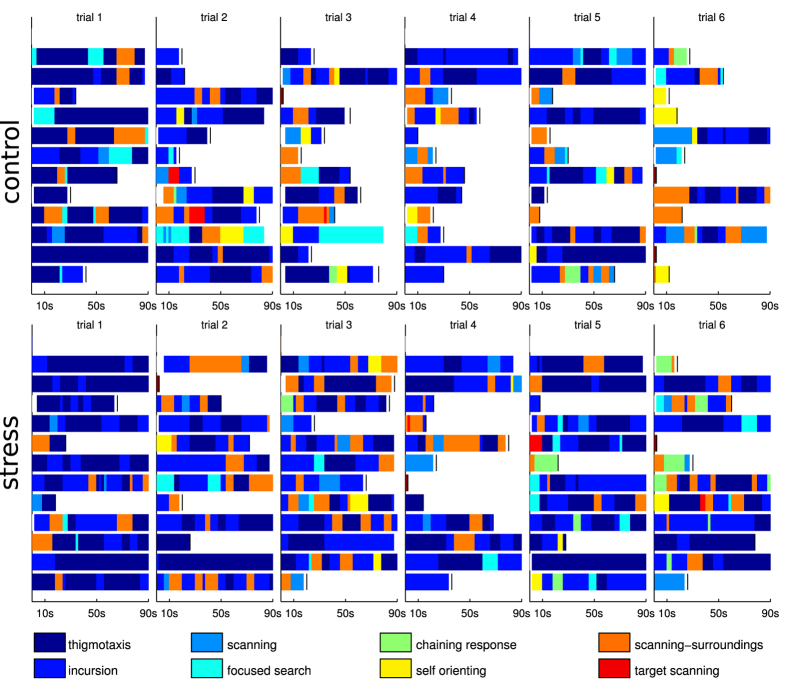
The Morris Water Maze is a widely used task in studies of spatial learning with rodents. Classical performance measures of animals in the Morris Water Maze include the escape latency, and the cumulative distance to the platform. Other methods focus on classifying trajectory patterns to stereotypical classes representing different animal strategies. However, these approaches typically consider trajectories as a whole, and as a consequence they assign one full trajectory to one class, whereas animals often switch between these strategies, and their corresponding classes, within a single trial. To this end, we take a different approach: we look for segments of diverse animal behaviour within one trial and employ a semi-automated classification method for identifying the various strategies exhibited by the animals within a trial. Our method allows us to reveal significant and systematic differences in the exploration strategies of two animal groups (stressed, non-stressed), that would be unobserved by earlier methods.


Figures

Figure 1
Figure 1. Comparison of full trajectory metrics for two groups of animals over a set of 12 trials.
White (black) boxes: control (stress) group. Boxes represent the first, second (median, shown as a band) and third quartiles; whiskers are the minimum and maximum values. Outliers are marked as a cross. The p-values of a Friedman non-parametric test comparing both groups of animals over the full set of trials is shown in each plot (see Methods for a discussion and interpretation of the Friedman test and the p-values). (A) Escape latency shows a wide dispersion of values until later trials. (B) Average movement speed shows that stressed animals move substantially faster than non-stressed ones. (C) Average path length. Stressed animals tend to sweep longer paths than control animals; the difference between the two groups is however less distinctive than when comparing the movement speeds.
Figure 2
Figure 2. Examples of swimming paths showing different types of behaviour.
Data: Laboratory of Behavioural Genetics, EPFL. Swimming paths were segmented and the generated segments were classified into a total of eight different types of behaviour, distinguishable by different line types/colours. Behavioural classes: (i) Thigmotaxis (solid-black lines): Time is spent almost exclusively next to the walls; (ii) Incursion (dashed-black lines): paths where animal still touches the walls but starts making incursions inwards; (iii) Scanning (dotted-black lines): characterised by tighter paths that sweep a specific region of the arena; (iv) Focused search (dotted-green lines): animal randomly searches a very small area of the arena; (v) Chaining response (dashed-green lines): concentric paths where the animal memorises the distance from the walls to the platform; (vi) Self-orienting (solid-green lines): Paths where the animal makes one full turn to orient himself; (vii) Scanning-surroundings (dotted-red lines): Open paths passing through a critical region around the platform; (viii) Target scanning (solid-red lines): search is focused on regions next to or surrounding the platform.
Figure 3
Figure 3
(A) Diagram illustrating the swimming path classification method. Swimming paths are first segmented and then classified by means of a semi-supervised clustering algorithm. (BE) Definition of variables used for computing the measures, or feature values, for each swimming path segment. The features are an essential part of the clustering process since the feature values are used to estimate how similar the different segments are.
Figure 4
Figure 4. Classification results for the 6 first trials and 12 animals from the control (top) and stress (bottom) group.
Each bar represents a full trial (up to 90 seconds) and shows changes in exploration strategies over the trial. Short paths, where the animal found the platform directly, and which were not segmented, are marked in dark red. White boxes indicate segments with behaviour not falling into any of the classes and which could not be categorised. The results show that paths almost always correspond to multiple types of behaviour. Also, it can be seen that on later trials animals are not only able to find the platform faster, but they also change their strategies.
Figure 5
Figure 5
(AH) Average segment lengths for each strategy adopted by stress (black) and control group (white) of animals for a set of 12 trials divided in 3 sessions (days). Plots show the average length in meters that animals spent in one strategy during each trial. Bars represent the first and third quartiles of the data; line shows the median and crosses the outliers. Whiskers (when shown) indicate minimum and maximum values. A Friedman test was used to compare both groups of animals over the complete set of trials; p-values are shown on the top right (see Methods for a discussion of the Friedman test and p-values). The results show that, as expected, stressed animals display longer average paths much more often but the increase is non-uniform among the different strategies. According to the plots there is a clear difference in the path lengths for the thigmotaxis, incursion, and scanning strategies, all of which are characterised by low chance of finding the platform. For the scanning-surroundings, self-orienting, and target scanning strategies, all which are associated with an increased chance of finding the platform, no statistically significant differences were found. Chaining response shows a slight difference in favour of the stress group; focused-search shows no significant differences. These results may explain why stressed animals sweep longer paths but on average they don’t find the platform faster that non-stressed animals (Fig. 1). (I) Number of transitions between strategies for both groups showing that stressed animals change their behaviour more often within single trials.

References

    1. Morris R. Developments of a water-maze procedure for studying spatial learning in the rat. J. Neurosci. Methods 11, 47–60 (1984). - PubMed
    1. Morris R. Spatial localization does not require the presence of local cues. Learn. Motiv. 260, 239–260 (1981).
    1. D’Hooge R. & Deyn P. D. Applications of the Morris water maze in the study of learning and memory. Brain Res. Rev. 36, 60–90 (2001). - PubMed
    1. Brandeis R., Brandys Y. & Yehuda S. The use of the morris water maze in the study of memory and learning. Int. J. Neurosci. 48, 29–69 (1989). - PubMed
    1. Vorhees C. & Williams M. Morris water maze: procedures for assessing spatial and related forms of learning and memory. Nat. Protoc. 1, 848–858 (2006). - PMC - PubMed

LinkOut - more resources