. 2015 Oct 1:5:14580.
doi: 10.1038/srep14580.

Three-dimensional matrix fiber alignment modulates cell migration and MT1-MMP utility by spatially and temporally directing protrusions

Affiliations

Three-dimensional matrix fiber alignment modulates cell migration and MT1-MMP utility by spatially and temporally directing protrusions

Stephanie I Fraley et al. Sci Rep. .

Abstract

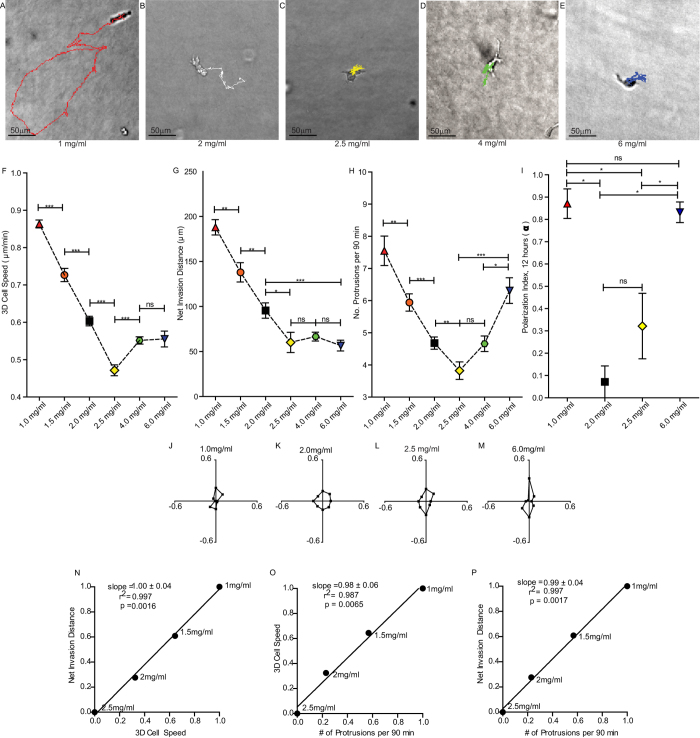
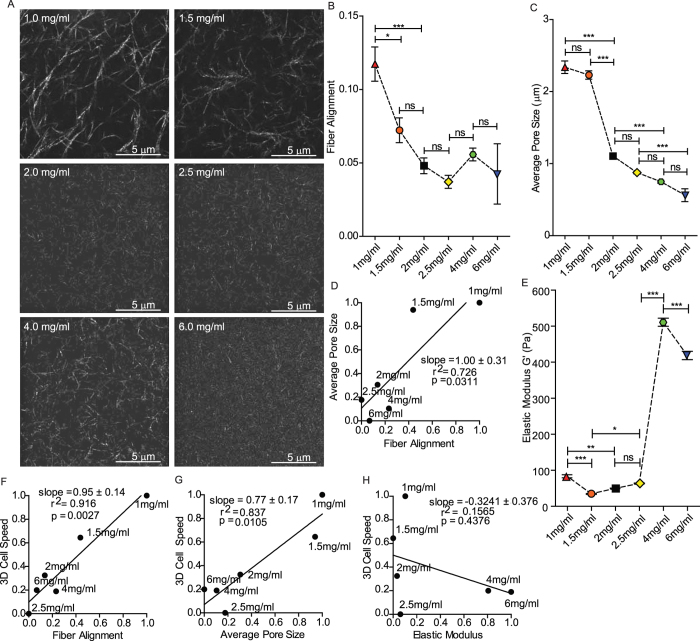
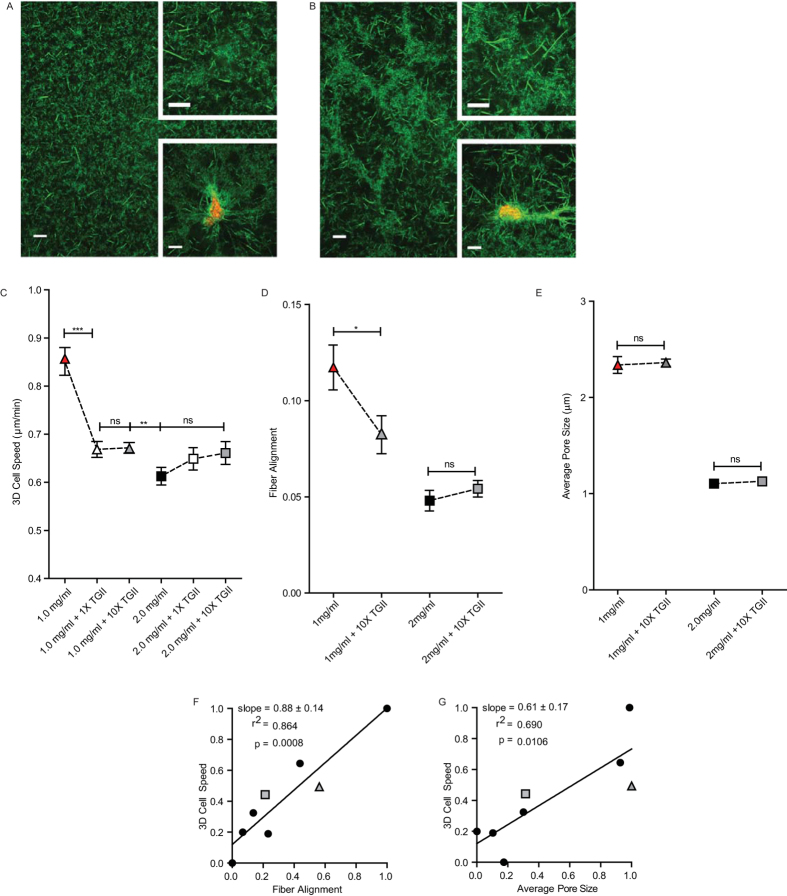
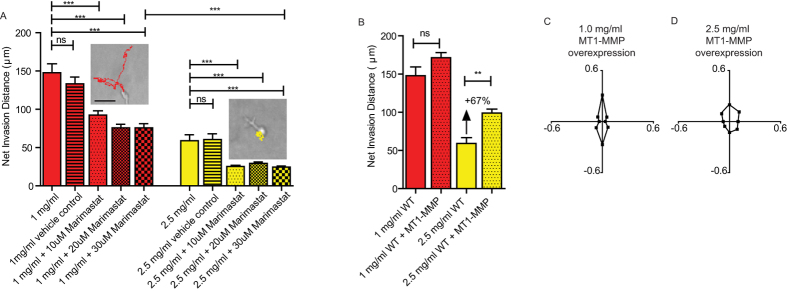
Multiple attributes of the three-dimensional (3D) extracellular matrix (ECM) have been independently implicated as regulators of cell motility, including pore size, crosslink density, structural organization, and stiffness. However, these parameters cannot be independently varied within a complex 3D ECM protein network. We present an integrated, quantitative study of these parameters across a broad range of complex matrix configurations using self-assembling 3D collagen and show how each parameter relates to the others and to cell motility. Increasing collagen density resulted in a decrease and then an increase in both pore size and fiber alignment, which both correlated significantly with cell motility but not bulk matrix stiffness within the range tested. However, using the crosslinking enzyme Transglutaminase II to alter microstructure independently of density revealed that motility is most significantly predicted by fiber alignment. Cellular protrusion rate, protrusion orientation, speed of migration, and invasion distance showed coupled biphasic responses to increasing collagen density not predicted by 2D models or by stiffness, but instead by fiber alignment. The requirement of matrix metalloproteinase (MMP) activity was also observed to depend on microstructure, and a threshold of MMP utility was identified. Our results suggest that fiber topography guides protrusions and thereby MMP activity and motility.


Figures

Figure 1
Figure 1. Cell motility parameters display a bi-phasic trend as collagen density is increased in a 3D matrix.
(A–E) Micrographs of typical single cells in varying concentrations of collagen matrix with 16.5 h cell migration trajectories overlaid. (F) Average speed of cells embedded in 3D matrices of increasing collagen density. (G) Average net invasion distance of cells migrating through varying concentrations of 3D collagen matrices over 16.5 h. (H) Average number of protrusions per 90 min generated by cells migrating through matrices of increasing collagen density. (I) Average polarization index for seven randomly chosen cells in each matrix condition over 12 h; a value of one indicates that cells remain polarized in their initial orientation and a value of zero indicates that cells repolarize equally in all directions. (J–M) Orientation of protrusions plots showing fraction of cellular protrusions extended in each direction during migration in 1, 2, 2.5 and 6 mg/ml collagen matrices. Fractions calculated from average of seven randomly chosen cells monitored for 12 h each. (NP) Correlation plots of min-max normalized invasion distance vs. 3D cell speed, 3D cell speed vs. number of protrusions per 90 min, and invasion distance vs. number of protrusions per 90 min. N = 3 independent repeats for each graph; at least 20 cells were analyzed per repeat. Correlation plots show slope, square of Pearson’s correlation coefficient, and p value of the linear dependence between the two normalized axis variables. Error bars represent s.e.m. ***p < 0.001; **p < 0.01; *p < 0.05
Figure 2
Figure 2. Influence of matrix microstructure on cell motility.
(A) Reflection confocal micrographs of 3D collagen matrices of increasing collagen density, scale bar is 5 μm. (B) Average extent of collagen fiber alignment measured by FFT analysis in matrices of varying concentrations of collagen. (C) Average pore size of collagen fibers in matrices of varying density. (D) Correlation plot of normalized average pore size vs. alignment of fibers. (E) Global shear elastic modulus of collagen matrices of varying densities. (F) Correlation plot of normalized 3D cell speed vs. alignment of fibers. (G) Correlation plot of normalized 3D cell speed vs. average pore size. (H) Correlation plot of normalized 3D cell speed vs. shear elastic modulus. N = 3 independent gelation repeats for each graph of matrix characteristics; images of at least 5 different positions within the central region of the matrix, far from the container walls, were used from each repeat. Error bars represent s.e.m. ***p < 0.001; **p < 0.01; *p < 0.05.
Figure 3
Figure 3. Additional crosslinking with TGII alters matrix microstructure and cell motility but leaves global collagen density unchanged.
(A,B) Reflection confocal micrographs of 2 mg/ml collagen matrix and 2 mg/ml collagen matrix further crosslinked with TGII, respectively, at three magnifications (background image, top inset, and bottom inset). Bottom insets show embedded cells labelled with red membrane marker. (C) Average speed of cells migrating through 1 mg/ml collagen or 2 mg/ml collagen with and without the addition of 1X or 10X TGII crosslinking enzyme. (D) Average extent of collagen fiber alignment measured by FFT analysis of 1 and 2 mg/ml collagen matrices with and without additional crosslinking by 10X TGII. (E) Average pore size of 1 and 2 mg/ml collagen matrices with and without additional crosslinking by 10X TGII. (F,G) Correlation plots of 3D cell speed vs. alignment of fibers and pore size (from Fig. 2) with 1 mg/ml and 2 mg/ml + 10X TGII data points added (grey triangle and square, respectively). N = 3 independent repeats for (CE); at least 20 cells were analyzed per repeat for (C) Scale bars in panels (A,B) are 100 μm, 5 μm, and 10 μm for background image, top inset, and bottom inset respectively. Error bars represent s.e.m. across all data points in all repeats for each condition. ***p < 0.001; **p < 0.01; *p < 0.05.
Figure 4
Figure 4. Effect of MMP inhibition on cell invasion depends on matrix conditions.
(A) Net invasion distance achieved by 1 or 2.5 mg/ml matrix embedded HT-1080 cells treated with vehicle (DMSO), 10 μM, 20 μM, or 30 μM Marimastat MMP inhibitor. Vehicle control concentration is equivalent to the 30 μM drug condition. Inset shows representative cells and their 16.5 h migration trajectories in 1 mg/ml + 30 μM Marimastat (left, red) and 2.5 mg/ml + 30 μM Marimastat (right, yellow). Scale bar is 50 μm. (B) Net invasion distance of 1 or 2.5 mg/ml matrix embedded HT-1080 cells with overexpression of MT1-MMP. (C) Protrusion orientation of MT1-MMP overexpressing cells in 1 mg/ml matrix over 12 h. (D) Protrusion orientation of MT1- MMP overexpressing cells in 2.5 mg/ml matrix over 12 h. N = 3 independent repeats for each condition, at least 20 cells were analyzed per repeat per condition. At least 300 protrusions total across at least 7 cells over 12 h increments were analyzed for each orientation graph. Error bars represent s.e.m. across all data points for each condition. ***p < 0.001, **p < 0.01.

References

    1. Fraley S. I. et al.. A distinctive role for focal adhesion proteins in three-dimensional cell motility. Nature Cell Biology 12, 598–604 (2010). - PMC - PubMed
    1. Meyer A. S. et al.. 2D protrusion but not motility predicts growth factor–induced cancer cell migration in 3D collagen. Journal of Cell Biology 197, 721–729 (2012). - PMC - PubMed
    1. Hakkinen K. M., Harunaga J. S., Doyle A. D. & Yamada K. M. Direct comparisons of the morphology, migration, cell adhesions, and actin cytoskeleton of fibroblasts in four different three-dimensional extracellular matrices. Tissue Engineering 17, 713–724 (2011). - PMC - PubMed
    1. Fraley S. I., Feng Y., Giri A., Longmore G. D. & Wirtz D. Dimensional and temporal controls of three-dimensional cell migration by zyxin and binding partners. Nature Communications 3, 719 (2012). - PMC - PubMed
    1. Tang X. et al.. Mechanical force affects expression of an in vitro metastasis-like phenotype in HCT-8 cells. Biophysical Journal 99, 2460–2469 (2010). - PMC - PubMed

Publication types