. 2015 Nov;26(11):1771-82.
doi: 10.1177/0956797615598970. Epub 2015 Sep 30.

Decoding Visual Location From Neural Patterns in the Auditory Cortex of the Congenitally Deaf

Affiliations

Decoding Visual Location From Neural Patterns in the Auditory Cortex of the Congenitally Deaf

Jorge Almeida et al. Psychol Sci. 2015 Nov.

Abstract

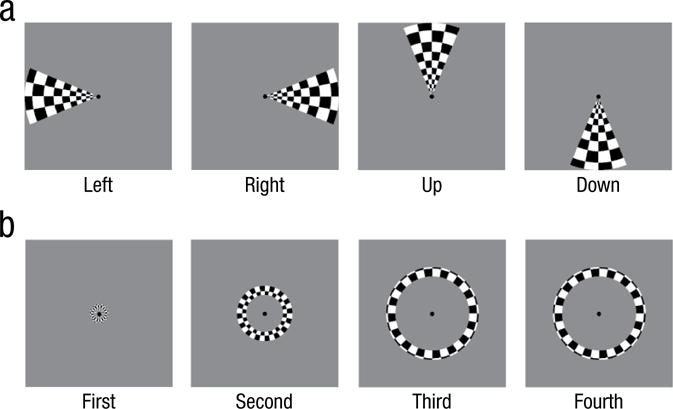
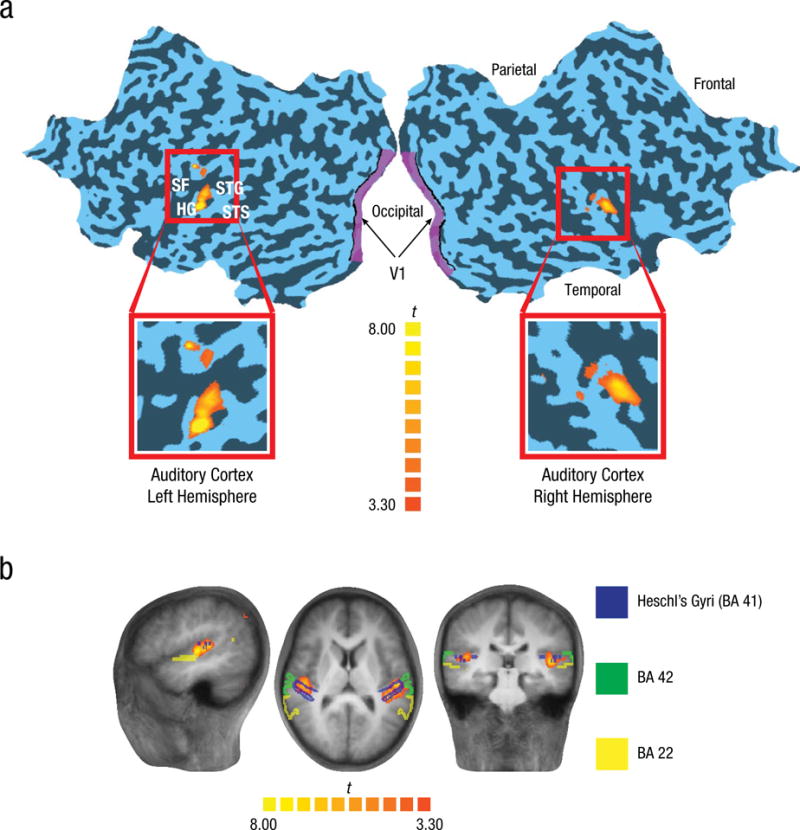
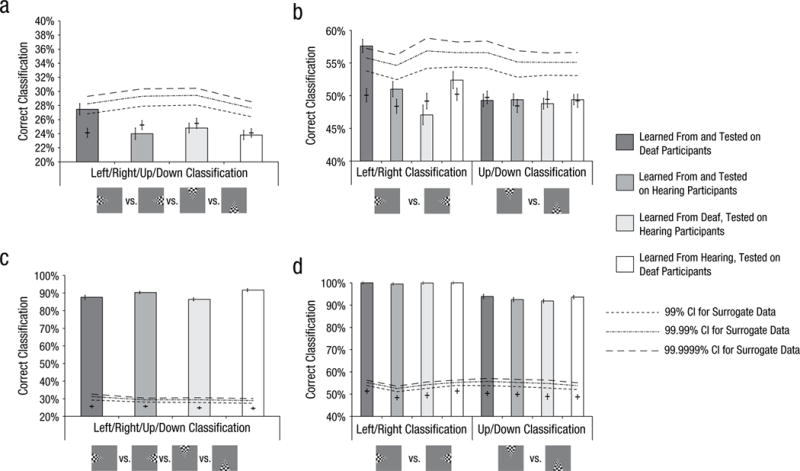
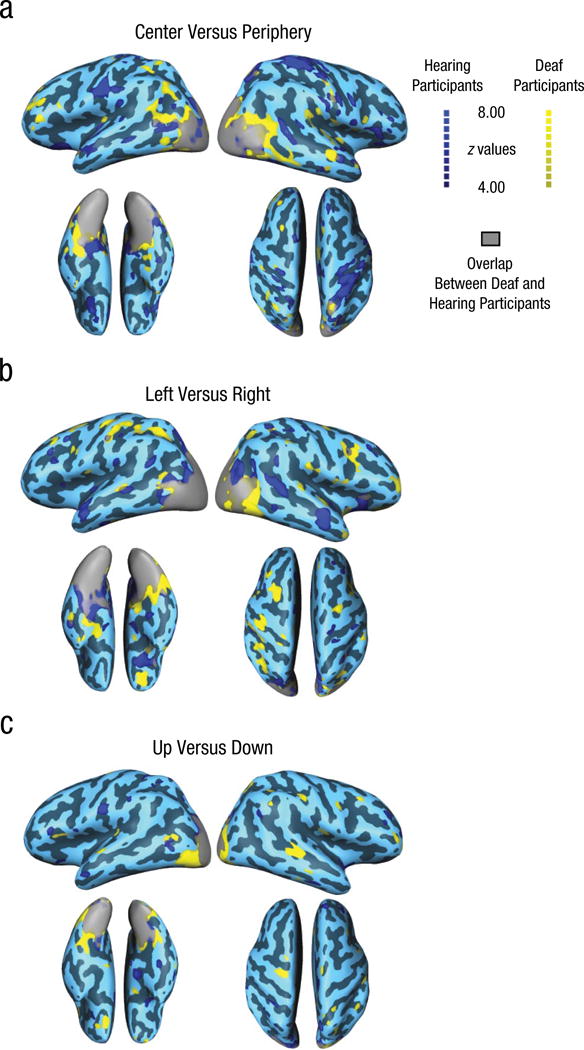
Sensory cortices of individuals who are congenitally deprived of a sense can exhibit considerable plasticity and be recruited to process information from the senses that remain intact. Here, we explored whether the auditory cortex of congenitally deaf individuals represents visual field location of a stimulus-a dimension that is represented in early visual areas. We used functional MRI to measure neural activity in auditory and visual cortices of congenitally deaf and hearing humans while they observed stimuli typically used for mapping visual field preferences in visual cortex. We found that the location of a visual stimulus can be successfully decoded from the patterns of neural activity in auditory cortex of congenitally deaf but not hearing individuals. This is particularly true for locations within the horizontal plane and within peripheral vision. These data show that the representations stored within neuroplastically changed auditory cortex can align with dimensions that are typically represented in visual cortex.

Keywords: congenital deafness; decoding; fMRI; multivariate pattern analysis; neuroplasticity; sensory reorganization; visual location.


Conflict of interest statement

Declaration of Conflicting Interests The authors declared that they had no conflicts of interest with respect to their authorship or the publication of this article.

Figures

Fig. 1
Fig. 1
Stimuli used in the experiments. Wedges (a) appeared alternately in each quadrant of the screen and were used for visual field location classification, and annuli (b) appeared at four different sizes in the center of the screen and were used for eccentricity classification.
Fig. 2
Fig. 2
Activations used to define auditory cortex in hearing participants. The two-dimensional projection of the surface of the brain (a) highlights the areas used for classification—the auditory cortex, defined on the basis of heightened responses to white noise compared with silence, and primary visual cortex (V1). The sagittal, axial, and coronal slices (b) show the location of the auditory cortex region of interest (ROI) with respect to known landmarks—Brodmann’s areas (BAs) 41, 42, and 22. The t maps show results from the contrast of white noise versus silence in the auditory cortex ROI. HG = Heschl’s gyrus, SF = Sylvian fissure, STG = superior temporal gyrus, STS = superior temporal sulcus.
Fig. 3
Fig. 3
Classification accuracy for real data (bars) and surrogate data (lines) in bilateral auditory cortex (top row) and visual cortex (bottom row). Performance is shown for the contrast between the four quadrants in which the wedge stimuli appeared (a, c) and for the contrasts between left versus right and up versus down wedges (b, d). In each data bar, the error bar showing ±1 SEM for the real data is toward the left, and the error bar showing ±1 SEM for the surrogate data is in the center. The horizontal bar crossing the error bars for surrogate data shows the mean. Some of the error bars for the real data are too small to be easily visible here. CI = confidence interval.
Fig. 4
Fig. 4
Results from the whole-brain searchlight analysis in deaf and hearing participants. Decoding performance effect maps (z values) are shown separately for the contrasts of (a) center versus periphery for annuli, (b) left versus right for wedges, and (c) up versus down for wedges. All z values shown (calculated against surrogate data) correspond to p values equal to or less than .0001.

References

    1. Barone P, Lacassagne L, Kral A. Reorganization of the connectivity of cortical field DZ in congenitally deaf cat. PLoS ONE. 2013;8(4) doi: 10.1371/journal.pone.0060093. Article e60093. - DOI - PMC - PubMed
    1. Bavelier D, Neville H. Cross-modal plasticity: Where and how? Nature Reviews Neuroscience. 2002;3:443–452. - PubMed
    1. Bavelier D, Tomann A, Hutton C, Mitchell T, Corina D, Liu G, Neville H. Visual attention to the periphery is enhanced in congenitally deaf individuals. The Journal of Neuroscience. 2000;20:1–6. - PMC - PubMed
    1. Bosworth RG, Dobkins KR. Visual field asymmetries for motion processing in deaf and hearing signers. Brain and Cognition. 2002;49:170–181. - PubMed
    1. Brainard MS, Knudsen EI. Experience-dependent plasticity in the inferior colliculus: A site for visual calibration of the neural representation of auditory space in the barn owl. The Journal of Neuroscience. 1993;13:4589–4608. - PMC - PubMed

Publication types

LinkOut - more resources