. 2015 Dec;169(4):2665-83.
doi: 10.1104/pp.15.01164. Epub 2015 Sep 30.

Metabolite Profiles of Maize Leaves in Drought, Heat, and Combined Stress Field Trials Reveal the Relationship between Metabolism and Grain Yield

Affiliations

Metabolite Profiles of Maize Leaves in Drought, Heat, and Combined Stress Field Trials Reveal the Relationship between Metabolism and Grain Yield

Toshihiro Obata et al. Plant Physiol. 2015 Dec.

Abstract

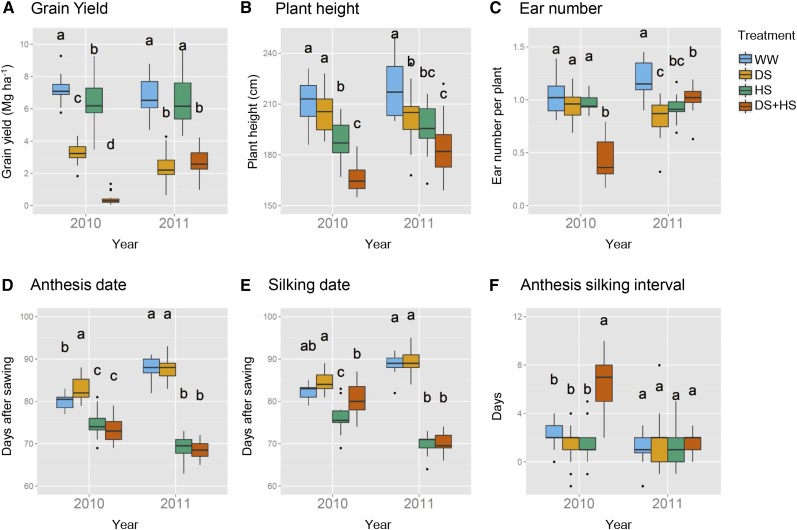
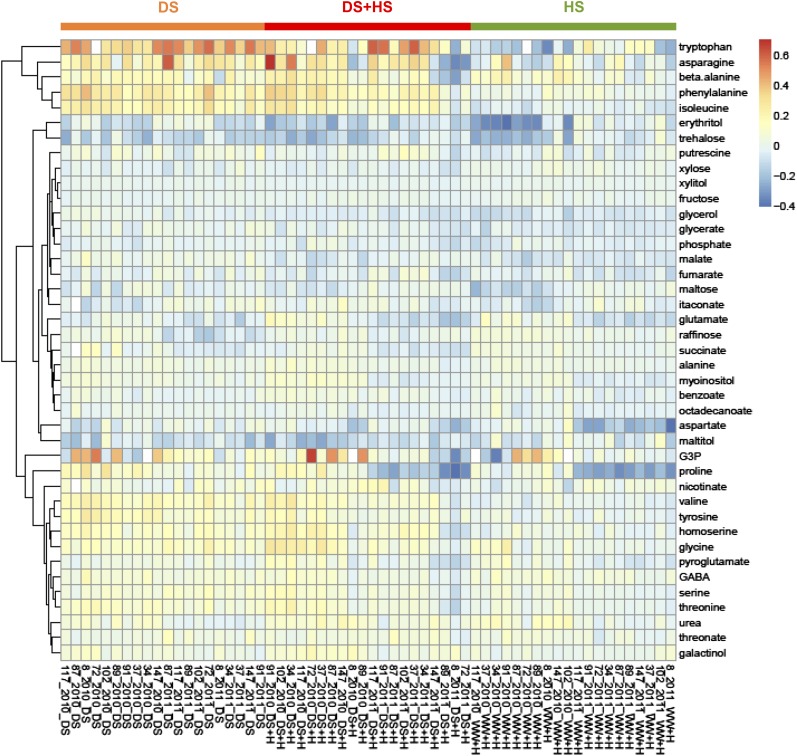
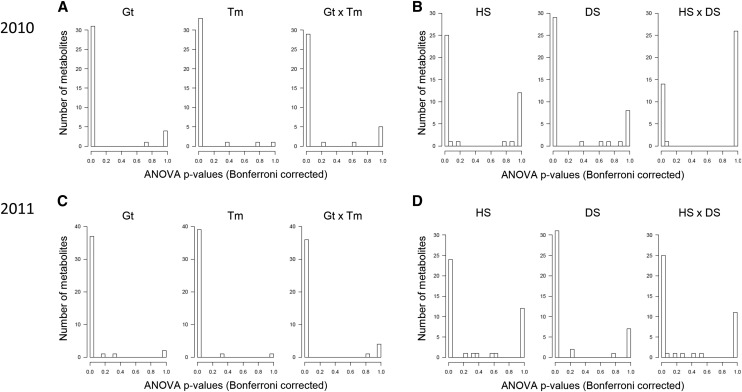
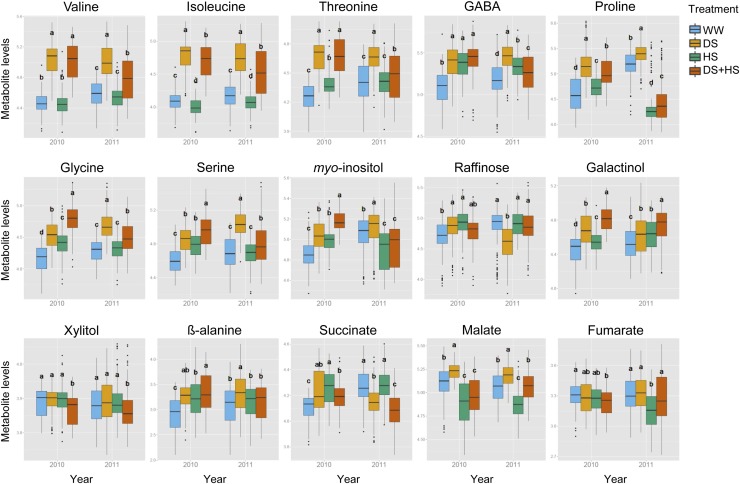
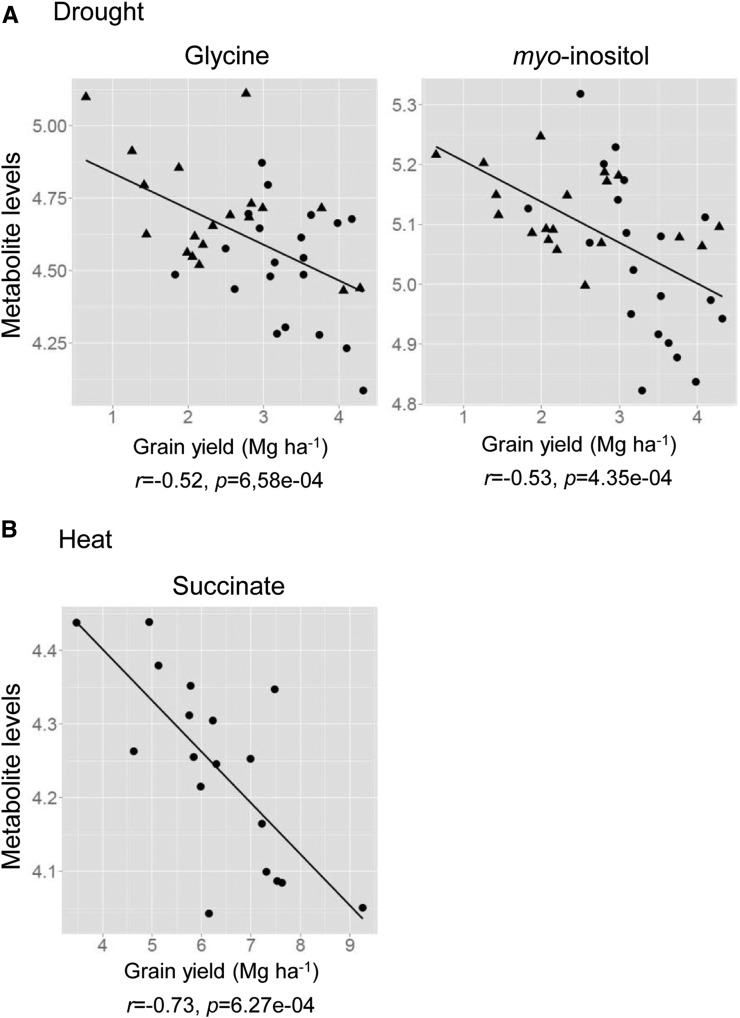
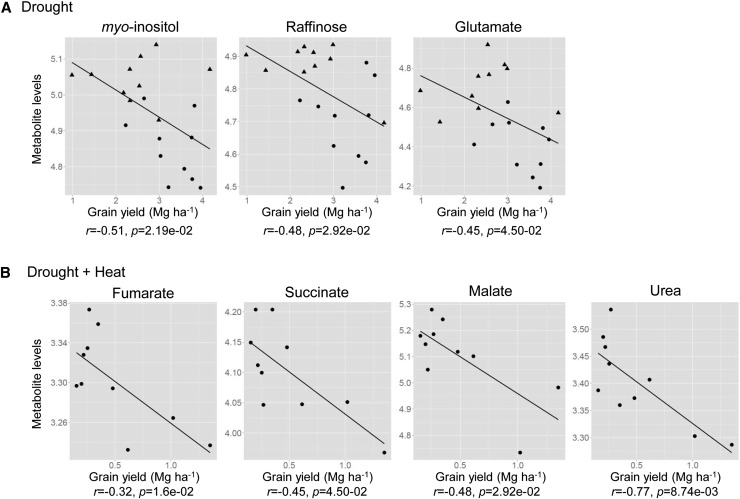
The development of abiotic stress-resistant cultivars is of premium importance for the agriculture of developing countries. Further progress in maize (Zea mays) performance under stresses is expected by combining marker-assisted breeding with metabolite markers. In order to dissect metabolic responses and to identify promising metabolite marker candidates, metabolite profiles of maize leaves were analyzed and compared with grain yield in field trials. Plants were grown under well-watered conditions (control) or exposed to drought, heat, and both stresses simultaneously. Trials were conducted in 2010 and 2011 using 10 tropical hybrids selected to exhibit diverse abiotic stress tolerance. Drought stress evoked the accumulation of many amino acids, including isoleucine, valine, threonine, and 4-aminobutanoate, which has been commonly reported in both field and greenhouse experiments in many plant species. Two photorespiratory amino acids, glycine and serine, and myoinositol also accumulated under drought. The combination of drought and heat evoked relatively few specific responses, and most of the metabolic changes were predictable from the sum of the responses to individual stresses. Statistical analysis revealed significant correlation between levels of glycine and myoinositol and grain yield under drought. Levels of myoinositol in control conditions were also related to grain yield under drought. Furthermore, multiple linear regression models very well explained the variation of grain yield via the combination of several metabolites. These results indicate the importance of photorespiration and raffinose family oligosaccharide metabolism in grain yield under drought and suggest single or multiple metabolites as potential metabolic markers for the breeding of abiotic stress-tolerant maize.


Figures

Figure 1.
Figure 1.
Yield-related parameters in the two years of field stress trials. Box plots show grain yield (A), plant height (B), number of ears per plant (C), anthesis date (D), silking date (E), and interval between anthesis and silking dates (F) in the 2010 and 2011 seasons. Ten maize hybrids were grown in WW (blue), DS (orange), WW and HS (green), and DS+HS (red) conditions in two independent plots (n = 20). Letters indicate the results of Tukey’s test comparing the conditions in each year (P < 0.05).
Figure 2.
Figure 2.
Heat map of metabolic responses to stress conditions in each genotype. Metabolite levels in each stress condition were normalized to that in the WW condition and log2 transformed. Values are means of up to 12 biological replicates. Red and blue colors represent increase and decrease of metabolites using a false-color scale, respectively. Samples from DS, DS+HS, and WW and HS conditions are arranged from the left. Genotypes are ordered by the grain yield in the corresponding stress condition (smallest at the left) in each year.
Figure 3.
Figure 3.
Effects of treatments and genotypes on the levels of individual metabolites. Histograms show the number of metabolites whose levels were altered, with indicated P values by Bonferroni-corrected two-way ANOVA analyzing the effects of genotypes (Gt) and treatments (Tm; A and C) or HS and DS (B and D). Each bar indicates a range of 0.05. Data from 2010 (A and B) and 2011 (C and D) were independently analyzed. Metabolite levels from six biological replicates in two independent plots (n = 12) were used for analysis.
Figure 4.
Figure 4.
Foliar metabolite levels in the two years of field stress trials. Box plots show the relative levels of selected metabolites in the 2010 and 2011 seasons. Only the metabolites discussed in “Discussion” are shown. Plots for all metabolites are shown in Supplemental Figure S3. Ten maize hybrids were grown in WW (blue), DS (orange), WW and HS (green), and DS+HS (red) conditions in two independent plots (n = 20). Letters indicate the results of Tukey’s test comparing the conditions in each year (P < 0.05).
Figure 5.
Figure 5.
Correlation between metabolite levels and grain yield under DS (A) and HS (B) conditions. Levels of selected metabolites showing significant correlation (P < 0.001; Table IV) were plotted against grain yield under stress conditions. Ten maize hybrids were grown in two independent plots (n = 20 per year), and means of metabolite levels from six biological replicates were plotted. No metabolite showed significant correlation to grain yield under DS+HS. Circles and triangles indicate data from 2010 and 2011, respectively. Due to a minor effect of heat treatment on grain yield in 2011, only 2010 data were used for the analysis of HS. r and p are the correlation coefficient and P value from Pearson correlation analysis, respectively.
Figure 6.
Figure 6.
Correlation between metabolite levels in the control condition and grain yield under DS (A) and DS+HS (B) conditions. Levels of selected metabolites under the WW condition showing significant correlation (P < 0.05; Table V) were plotted against grain yield under stress conditions. No organic metabolite showed significant correlation to grain yield under HS. Mean values from each of 10 maize hybrids (n = 10 per year) were plotted. Circles and triangles indicate data from 2010 and 2011, respectively. Due to a minor effect of heat treatment on grain yield in 2011, only 2010 data were used for the analysis of DS+HS. r and p are the correlation coefficient and P value from Pearson correlation analysis, respectively.

References

    1. Alexandersson E, Jacobson D, Vivier MA, Weckwerth W, Andreasson E (2014) Field-omics: understanding large-scale molecular data from field crops. Front Plant Sci 5: 286. - PMC - PubMed
    1. Araújo WL, Tohge T, Ishizaki K, Leaver CJ, Fernie AR (2011) Protein degradation: an alternative respiratory substrate for stressed plants. Trends Plant Sci 16: 489–498 - PubMed
    1. Araus JL, Cairns JE (2014) Field high-throughput phenotyping: the new crop breeding frontier. Trends Plant Sci 19: 52–61 - PubMed
    1. Araus JL, Serret MD, Edmeades GO (2012) Phenotyping maize for adaptation to drought. Front Physiol 3: 305. - PMC - PubMed
    1. Araus JL, Slafer GA, Royo C, Serret MD (2008) Breeding for yield potential and stress adaptation in cereals. CRC Crit Rev Plant Sci 27: 377–412

Publication types

LinkOut - more resources