. 2015 Dec 1;26(24):4347-57.
doi: 10.1091/mbc.E14-06-1130. Epub 2015 Sep 30.

PP2A/B56 and GSK3/Ras suppress PKB activity during Dictyostelium chemotaxis

Affiliations

PP2A/B56 and GSK3/Ras suppress PKB activity during Dictyostelium chemotaxis

Marbelys Rodriguez Pino et al. Mol Biol Cell. .

Abstract

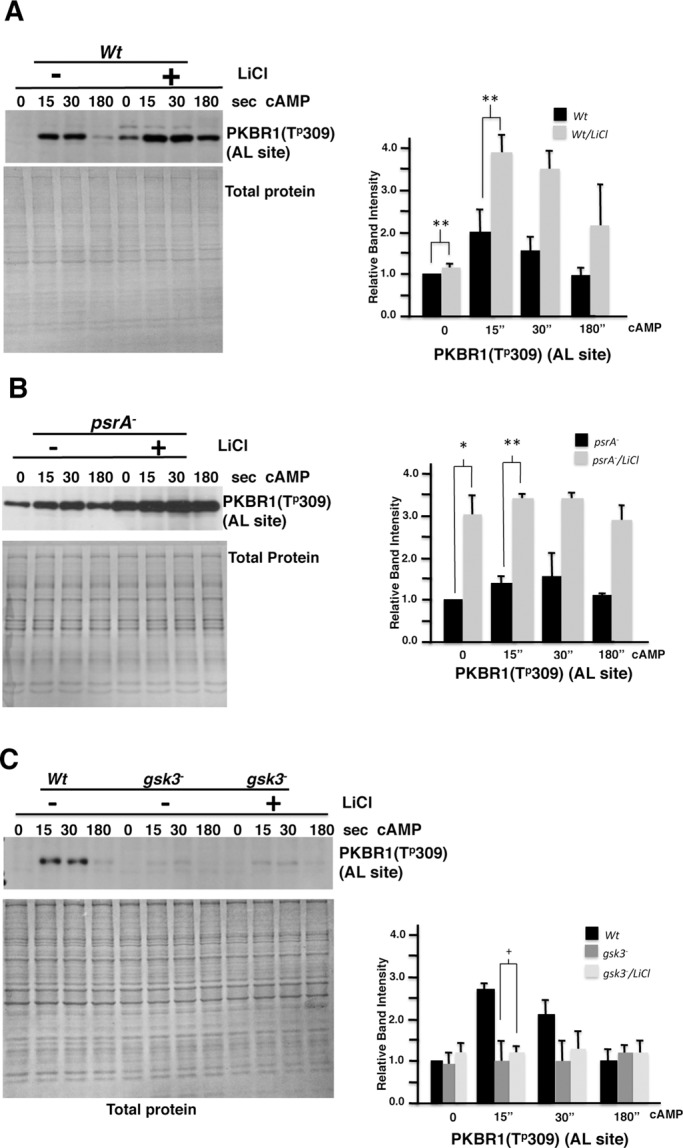
We have previously shown that the Dictyostelium protein phosphatase 2A regulatory subunit B56, encoded by psrA, modulates Dictyostelium cell differentiation through negatively affecting glycogen synthase kinase 3 (GSK3) function. Our follow-up research uncovered that B56 preferentially associated with GDP forms of RasC and RasD, but not with RasG in vitro, and psrA(-) cells displayed inefficient activation of multiple Ras species, decreased random motility, and inefficient chemotaxis toward cAMP and folic acid gradient. Surprisingly, psrA(-) cells displayed aberrantly high basal and poststimulus phosphorylation of Dictyostelium protein kinase B (PKB) kinase family member PKBR1 and PKB substrates. Expression of constitutively active Ras mutants or inhibition of GSK3 in psrA(-) cells increased activities of both PKBR1 and PKBA, but only the PKBR1 activity was increased in wild-type cells under the equivalent conditions, indicating that either B56- or GSK3-mediated suppressive mechanism is sufficient to maintain low PKBA activity, but both mechanisms are necessary for suppressing PKBR1. Finally, cells lacking RasD or RasC displayed normal PKBR1 regulation under GSK3-inhibiting conditions, indicating that RasC or RasD proteins are essential for GSK3-mediated PKBR1 inhibition. In summary, B56 constitutes inhibitory circuits for PKBA and PKBR1 and thus heavily affects Dictyostelium chemotaxis.


Figures

FIGURE 1:
FIGURE 1:
B56 associated with Ras proteins in addition to PP2A catalytic subunit. (A) GST-B56 pull-down assay uncovered that Dictyostelium B56 can associate with Ras proteins and PP2A catalytic subunit. Neither PP2Ac nor Ras proteins were detected from GST control. (B) GST-B56 exhibited stronger association with Flag-RasD over Flag-RasG (marked with arrowheads). (C) Flag-RasC is another Dictyostelium Ras species that showed strong association with B56. Bands corresponding to Flag-RasD and Flag-RasC are marked with arrowheads. Representative data from three independent experiments are shown.
FIGURE 2:
FIGURE 2:
The GDP-bound or inactive form of Ras preferably associated with B56. (A) Stimulation of whole-cell lysate with GTPγS increased Flag-RasD and Flag-RasC binding to GST-Raf1-RBD, but exhibited the opposite pattern with GST-B56. (B) Dominant-negative forms of recombinant Flag-RasD(S17N) and Flag-RasC(S18N) displayed strong binding to GST-B56 but not the constitutive active forms of Flag-RasD(G12T) and Flag-RasC(G13T). The constitutive active Ras mutants showed stronger binding to GST-Raf1-RBD as expected. The dominant-negative mutants showed much weaker binding to GST-Raf1-RBD. Representative data from three independent experiments are shown.
FIGURE 3:
FIGURE 3:
The chemoattractant cAMP-induced Ras activation was compromised in psrA cells. (A) psrA cells exhibited reduced amplitude of Raf1-RBD binding activity (presumably GTP-RasD and GTP-RasG) in response to cAMP stimulation compared with Wt cells. The Raf1-RBD binding activity of psrA cells at 5 s after cAMP stimulation is only ∼60% compared with that of wild-type cells (three independent experiments; *, p <0.05). (B) psrA cells also showed similar reduction (∼30%) in Byr2-RBD binding activity (presumably GTP-RasC) in response to cAMP stimulation compared with Wt cells (three independent experiments, t test; *, p < 0.05). Error bars represent SD.
FIGURE 4:
FIGURE 4:
psrA cells displayed compromised random motility and chemotaxis. (A and B) Aggregation-competent wild-type cells after 4 h of pulsatile cAMP stimulation displayed robust random (∼10 μm/min) and directional (8 μm/min) motility toward cAMP gradient (10 μM cAMP). In contrast, psrA cells exhibited only ∼50% of random and ∼40% of directional motility compared with wild-type cells. The chemotaxis index of psrA cells toward cAMP gradient was ∼50% of that for wild type. Error bars represent SD. All three p values were < 0.01. (C) Axenically grown vegetative wild-type and psrA cells were challenged with 0.1 mM folic acid, and their movements were analyzed for 20 min. The chemotaxis index and speed of movement of psrA cells under folic acid gradient were reduced to ∼60% and ∼50% of the wild-type level, respectively. Error bars represent SE of the mean. All p values were < 0.01.
FIGURE 5:
FIGURE 5:
psrA cells exhibited aberrantly high PKBR1 activity and PKB substrate phosphorylation. (A) Compared with Wt cells, psrA cells exhibited an abnormally high basal level of phosphorylated PKBR1 at the AL site, which persisted in response to cAMP stimulation. The levels of basal PKBR1 phosphorylation in psrA cells are consistently higher (approximately three times) than those of wild-type cells (three independent experiments; **, p < 0.01). The levels of basal PKBA phosphorylation of Wt and psrA cells showed no statistically significant difference (+, p > 0.05). PKBA also displayed persistent activation in response to cAMP stimulation in psrA cells. The phospho-PKB levels were normalized to Coomassie-stained total proteins. (B) psrA cells also displayed aberrantly higher basal and poststimulus levels of phosphorylated PKBR1 at the HM site in response to cAMP stimulation. (C) Phosphorylation levels of PKB substrates in psrA and Wt cells were detected using the anti–phospho Akt substrate antibody. psrA cells displayed significantly increased basal level of phosphoproteins. Some of these proteins seem to be psrA cell specific as marked (*), and the others could be assigned to the previously reported PKBR1/PKBA substrate proteins (pp350, pp280 for TalinB, pp200/pp180 for GefN, pp140 for GacG/PakA, pp110 for GefS/PI5K, pp65/67 for GacQ; Cai et al., 2010). (D) Comparable levels of PKBR1 messages were detected from wild-type and psrA cells by RT-PCR. Ig7 messages were shown as loading control. Error bars represent SD.
FIGURE 6:
FIGURE 6:
Introducing constitutively active RasD increased PKBR1 and PKBA activities in psrA cells. (A) Wild-type and psrA cells expressing Flag-RasD proteins were stimulated with cAMP, and the total amount of Flag-RasD was normalized. Then the active Flag-RasD protein levels were determined using GST-RBD followed by anti-Flag Western blotting. Relative active RasD levels were quantitated by normalizing the total Flag-RasD amount in the input. (B) Wt cells expressing Flag-RasD(G12T) also exhibited augmented basal and poststimulus phosphorylation of PKBR1 (three independent experiments, 2.5 times higher 15-s poststimulus level; *, p < 0.05). Wt cells expressing Flag-RasD(G12T) showed no significant changes in the levels of PKBA phosphorylation (+, p > 0.05). The phospho-PKBR1 levels were normalized to Coomassie-stained total proteins. (C) Introducing the constitutively active Flag-RasD(G12T) in psrA cells resulted in even higher basal and poststimulus PKBR1 phosphorylation (three independent experiments, approximately twofold higher at 15-s poststimulation; **, p < 0.01). Significantly higher levels of poststimulus phosphorylation of PKBA were observed in Flag-RasD(G12T)–expressing psrA cells (**, p < 0.01). The phospho-PKBR1 levels were normalized to Coomassie-stained total proteins. (D) psrA cells expressing Flag-RasC(G13T), as previously reported (Cai et al., 2010), showed increases in basal and poststimulus phosphorylation of PKBR1 (three independent experiments, ∼2.5-fold higher basal level; **, p < 0.01; 35% higher 15-s poststimulation; *, p < 0.05), but no such change was observed for PKBA. The phospho-PKBR1 levels were normalized to Coomassie-stained total proteins. Error bars represent SD.
FIGURE 7:
FIGURE 7:
Introducing dnGSK3 increased PKBA and PKBR1 activities in psrA cells. (A) Wt cells expressing the dnGSK3 exhibited higher levels of basal phosphorylation of PKBR1, which persisted upon cAMP stimulation (*, p < 0.05). No such significant changes were observed for PKBA phosphorylation (+, p > 0.05). The phospho-PKBR1 levels were normalized to Coomassie-stained total proteins. (B) psrA expressing the dnGSK3 showed high basal and persistent poststimulus phosphorylation of PKBR1 (three independent experiments, ∼2.5-fold higher basal and twofold increase in 15-s poststimulus levels; +, p < 0.05) and exaggerated poststimulus phosphorylation of PKBA. The phospho-PKBs levels were normalized to Coomassie-stained total proteins. Error bars represent SD.
FIGURE 8:
FIGURE 8:
Cells treated with LiCl exhibited increased PKBR1 activation. (A) Wt cells treated with GSK3 inhibitor, LiCl, showed increased poststimulus phosphorylation levels of PKBR1 compared with untreated cells: Wt cells treated with LiCl exhibited ∼30% increase in the basal level of PKBR1 activity and an approximately twofold increase in the level of PKBR1 phosphorylation after cAMP stimulation compared with nontreated cells (**, p < 0.01). The phospho-PKBR1 levels were normalized to Coomassie-stained total proteins. (B) LiCl-treated psrA cells exhibited even higher levels of basal phosphorylation of PKBR1 compared with nontreated psrA cells (p < 0.05). At 5-s poststimulus, the phosphorylation level of LiCl-treated psrA cells was consistently higher than the control (**, p < 0.01). The phospho-PKBR1 levels were normalized to Coomassie-stained total proteins. (C) Unlike Wt or psrA cells, cells lacking GSK3 showed no significant differences in PKBR1 phosphorylation in response to LiCl treatment (+, p > 0.05). The phospho-PKBR1 levels were normalized to Coomassie-stained total proteins. Error bars represent SD.
FIGURE 9:
FIGURE 9:
dnGSK3- and LiCl-mediated regulation of phosphorylation of PKBR1 is Ras dependent. (A) rasD cells showed normal basal and comparable poststimulus phosphorylation of PKBR1. rasD cells expressing dnGSK3 displayed no significant increase in the basal phosphorylation levels of PKBR1 and PKBA. In response to cAMP stimulation, rasD cells expressing dnGSK3 exhibited comparable levels of PKBR1 phosphorylation compared with rasD cells (+, p > 0.05). The phospho-PKBR1 levels were normalized to Coomassie-stained total proteins. (B and C) rasD and rasC cells treated with LiCl showed no significant changes in the basal and poststimulus phosphorylation levels of PKBR1 (+, p > 0.05). The phospho-PKBR1 levels were normalized to Coomassie-stained total proteins. Error bars represent SD.

References

    1. Bandala-Sanchez E, Annesley SJ, Fisher PR. A phototaxis signalling complex in Dictyostelium discoideum. Eur J Cell Biol. 2006;85:1099–1106. - PubMed
    1. Bolourani P, Spiegelman G, Weeks G. Ras proteins have multiple functions in vegetative cells of Dictyostelium. Eukaryot Cell. 2010;9:1728–1733. - PMC - PubMed
    1. Cai H, Das S, Kamimura Y, Long Y, Parent C, Devreotes P. Ras mediated activation of the TORC2-PKB pathway is critical for chemotaxis. J Cell Biol. 2010;190:233–245. - PMC - PubMed
    1. Charest P, Shen Z, Lakoduk A, Sasaki A, Briggs S, Firtel R. A Ras signaling complex controls the RasC-TORC2 pathway and directed cell migration. Dev Cell. 2010;18:737–749. - PMC - PubMed
    1. Chattwood A, Bolourani P, Weeks G. RasG signaling is important for optimal folate chemotaxis in Dictyostelium. BMC Cell Biology. 2014;15:13. - PMC - PubMed

Publication types

MeSH terms