. 2015 Sep 30;35(39):13430-47.
doi: 10.1523/JNEUROSCI.0777-15.2015.

Zac1 Regulates the Differentiation and Migration of Neocortical Neurons via Pac1

Affiliations

Zac1 Regulates the Differentiation and Migration of Neocortical Neurons via Pac1

Lata Adnani et al. J Neurosci. .

Erratum in

  • J Neurosci. 2015 Nov 25;35(47):15767

Abstract

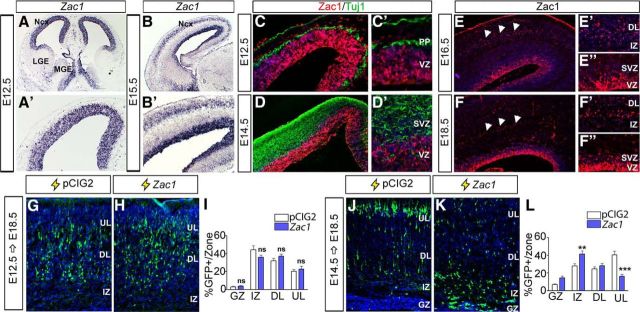
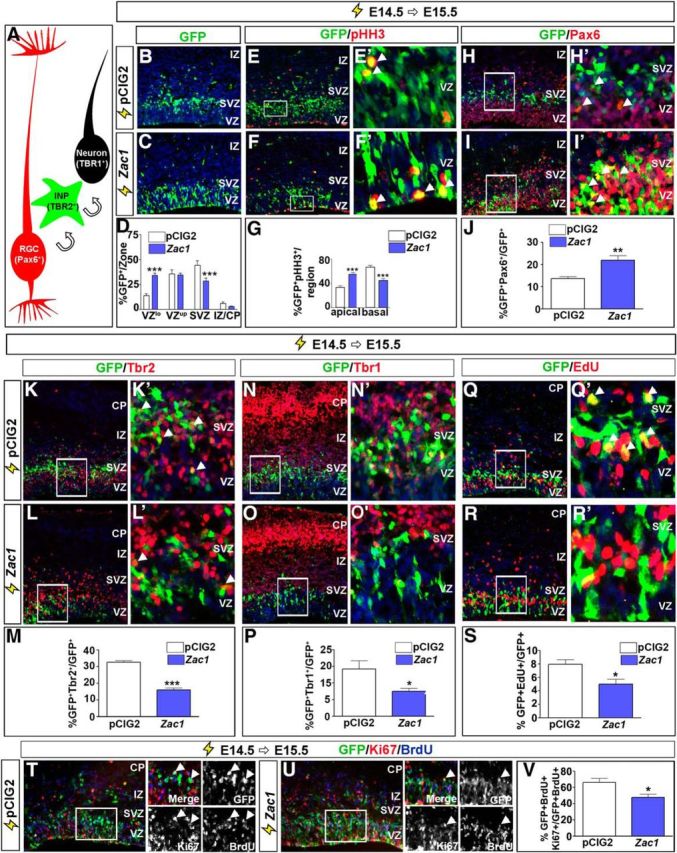
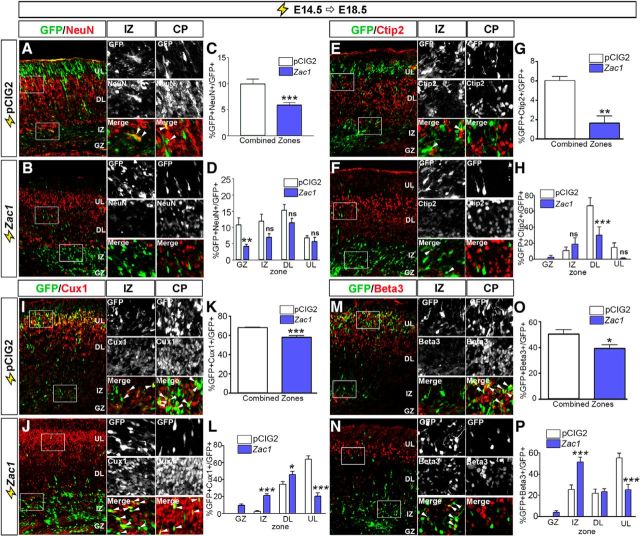
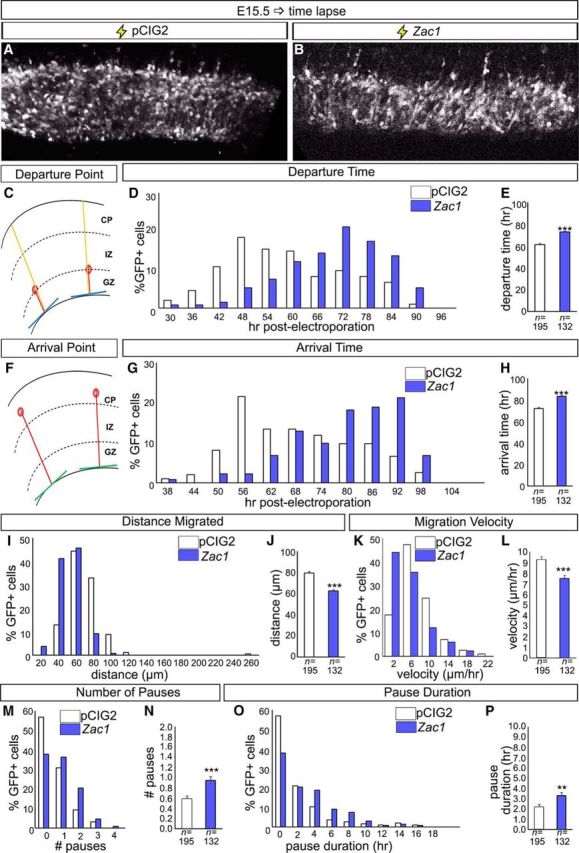
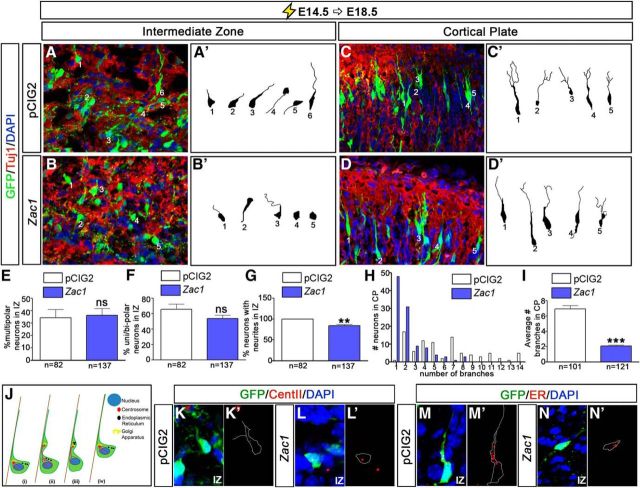
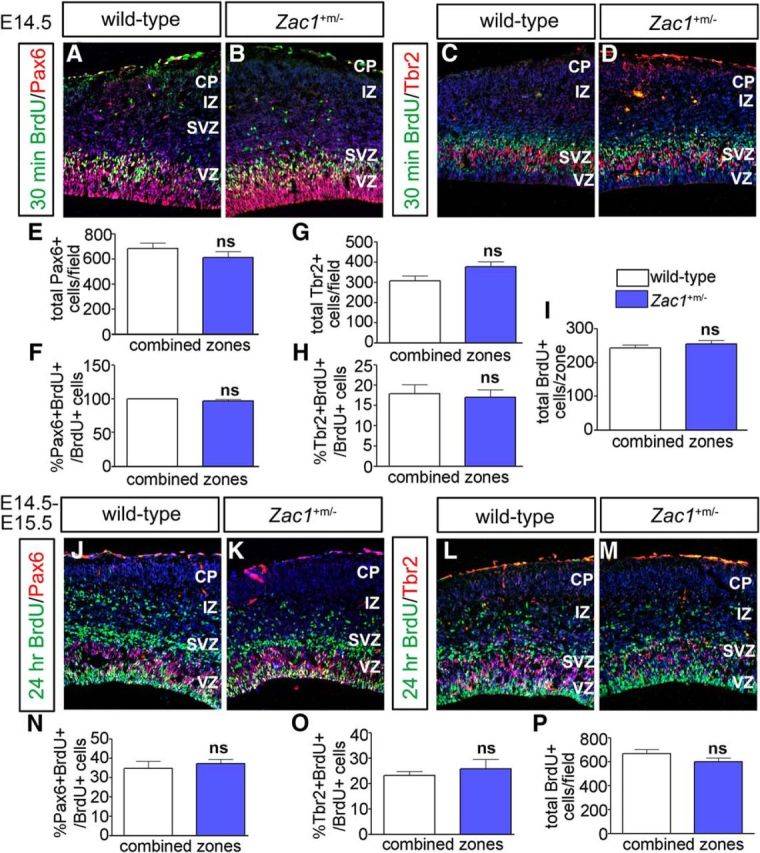
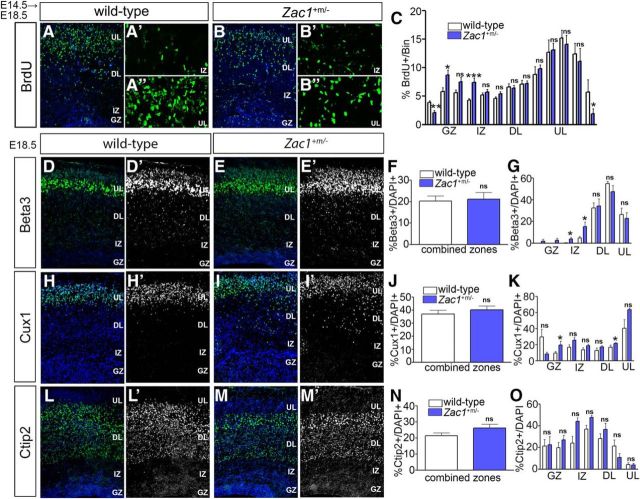
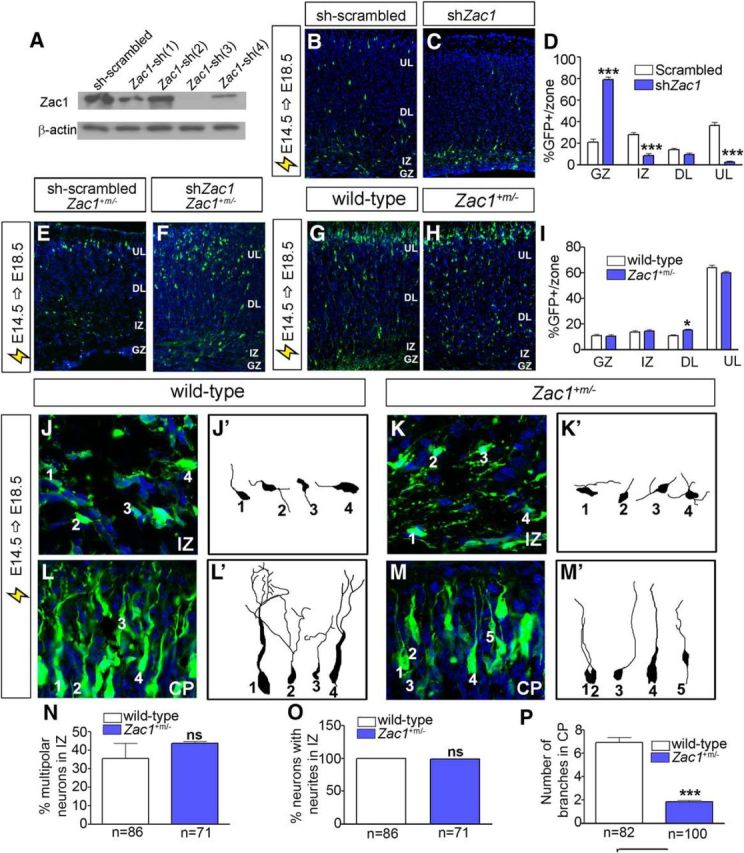
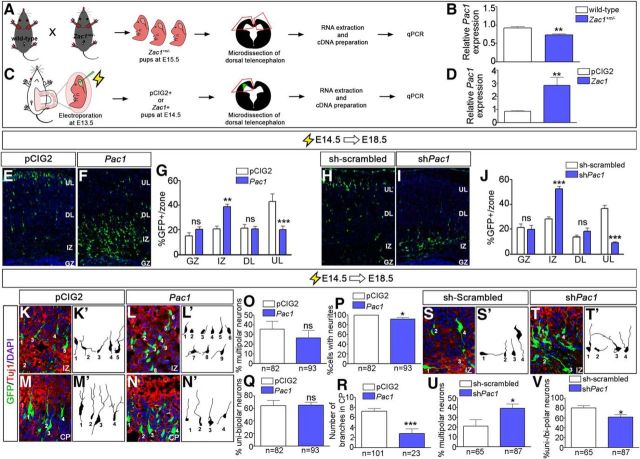
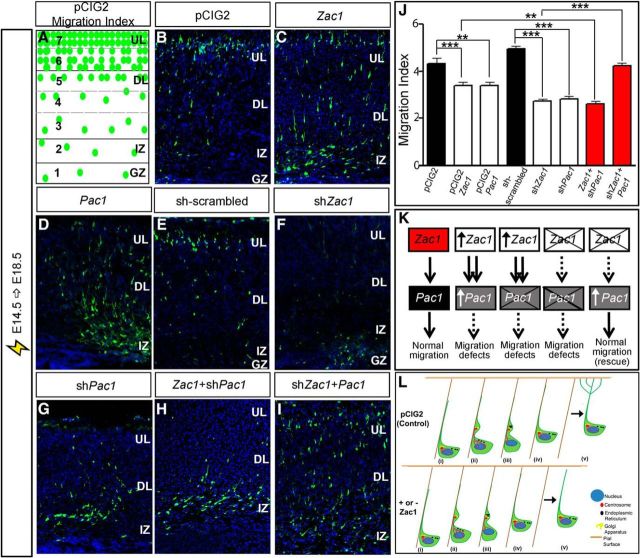
Imprinted genes are dosage sensitive, and their dysregulated expression is linked to disorders of growth and proliferation, including fetal and postnatal growth restriction. Common sequelae of growth disorders include neurodevelopmental defects, some of which are indirectly related to placental insufficiency. However, several growth-associated imprinted genes are also expressed in the embryonic CNS, in which their aberrant expression may more directly affect neurodevelopment. To test whether growth-associated genes influence neural lineage progression, we focused on the maternally imprinted gene Zac1. In humans, either loss or gain of ZAC1 expression is associated with reduced growth rates and intellectual disability. To test whether increased Zac1 expression directly perturbs neurodevelopment, we misexpressed Zac1 in murine neocortical progenitors. The effects were striking: Zac1 delayed the transition of apical radial glial cells to basal intermediate neuronal progenitors and postponed their subsequent differentiation into neurons. Zac1 misexpression also blocked neuronal migration, with Zac1-overexpressing neurons pausing more frequently and forming fewer neurite branches during the period when locomoting neurons undergo dynamic morphological transitions. Similar, albeit less striking, neuronal migration and morphological defects were observed on Zac1 knockdown, indicating that Zac1 levels must be regulated precisely. Finally, Zac1 controlled neuronal migration by regulating Pac1 transcription, a receptor for the neuropeptide pituitary adenylate cyclase-activating polypeptide (PACAP). Pac1 and Zac1 loss- and gain-of-function presented as phenocopies, and overexpression of Pac1 rescued the Zac1 knockdown neuronal migration phenotype. Thus, dysregulated Zac1 expression has striking consequences on neocortical development, suggesting that misexpression of this transcription factor in the brain in certain growth disorders may contribute to neurocognitive deficits. Significance statement: Altered expression of imprinted genes is linked to cognitive dysfunction and neuropsychological disorders, such as Angelman and Prader-Willi syndromes, and autism spectrum disorder. Mouse models have also revealed the importance of imprinting for brain development, with chimeras generated with parthenogenetic (two maternal chromosomes) or androgenetic (two paternal chromosomes) cells displaying altered brain sizes and cellular defects. Despite these striking phenotypes, only a handful of imprinted genes are known or suspected to regulate brain development (e.g., Dlk1, Peg3, Ube3a, necdin, and Grb10). Herein we show that the maternally imprinted gene Zac1 is a critical regulator of neocortical development. Our studies are relevant because loss of 6q24 maternal imprinting in humans results in elevated ZAC1 expression, which has been associated with neurocognitive defects.

Keywords: Pac1; Zac1; neocortex; neuronal migration; progenitor maturation.


Figures

Figure 1.
Figure 1.
Zac1 overexpression perturbs cell migration during later stages of corticogenesis. A, B, Zac1 transcript distribution in E12.5 (A, A′) and E15.5 (B, B′) telencephalon. A′ and B′ are high-magnification images of A and B, respectively. C–F, Distribution of Zac1 (red, C–F″) and Tuj1 (green, C, D) protein in the E12.5 (C, C′), E14.5 (D, D′), E16.5 (E–E″), and E18.5 (F–F″) neocortex. C′–F′ are higher-magnification images of C–F, respectively. Arrowheads in E and F mark CP expression. Comparison of E12.5–E18.5 (G–I) and E14.5–E18.5 (J–L) electroporations of pCIG2 control (G, J) and pCIG2-Zac1 (H, K) analyzed for the distribution of GFP+ cells/zone (I, L).
Figure 2.
Figure 2.
Zac1 overexpression delays progenitor cell maturation and neuronal differentiation. A, Schematic illustration of cells transitioning from Pax6+ RGCs to Tbr2+ INPs to Tbr1+ differentiated neurons. B–S, E14.5–E15.5 electroporations of pCIG2 control (B, E, H, K, N, Q) and pCIG2–Zac1 (C, F, I, L, O, R) costained for GFP and pHH3 (E, E′, F, F′), GFP and Pax6 (H, H′, I, I′), GFP and Tbr2 (K, K′, L, L′), GFP and Tbr1 (N, N′, O, O′), and GFP and EdU (Q, Q′, R, R′). E′, F′, H′, I′, K′, L′, N′, O′, R′, and Q′ are high-magnification images of boxed regions in E, F, H, I, K, L, N, O, R, and Q, respectively. Arrowheads in E′, F′, H′, I′, K′, L′, and Q′ mark double-positive cells. Quantitation of GFP+ cells/zone (D), percentage pHH3+GFP+ mitotic cells in apical and basal regions of the cortex (G), percentage Pax6+GFP+/GFP+ cells (J), percentage Tbr2+GFP+/GFP+ cells (M), percentage Tbr1+GFP+/GFP+ cells (P), and percentage EdU+ GFP+/GFP+ cells (S) after the electroporation of pCIG2 (white bars, n = 3) and pCIG2–Zac1 (blue bars, n = 3). T–V, E14.5–E15.5 electroporations of pCIG2 control (T) and pCIG2-Zac1 (U) costained for GFP (green), Ki67 (blue), and BrdU (red) after a 24 h BrdU pulse. Quantitation of percentage Ki67+BrdU+GFP+/GFP+BrdU+ cells (V). Arrowheads in T and U point to BrdU+ proliferating cells that have been electroporated (GFP+) and have remained in the cell cycle (Ki67+). DAPI labeling is in blue for B–R′.
Figure 3.
Figure 3.
Zac1 overexpression blocks neuronal differentiation. A–P, E14.5–E18.5 electroporations of pCIG2 control (A, E, I, M) and pCIG2–Zac1 (B, F, J, N) analyzed for the expression of GFP and NeuN (A, B), GFP and Ctip2 (E, F), GFP and Cux1 (I, J), and GFP and Beta3 (M, N). Insets to the right are high-magnification images of boxed regions in the IZ and CP in A, B, E, F, I, J, M, and N, and arrowheads mark double-positive cells. Quantitation of percentage NeuN+GFP+/GFP+ cells in total (C) and per zone (D), Ctip2+ GFP+/GFP+ cells in total (G) and per zone (H), Cux1+ GFP+/GFP+ cells in total (K) and per zone (L), and Beta3+ GFP+/GFP+ cells in total (O) and per zone (P) after the electroporation of pCIG2 (white bars, n = 3) and pCIG2–Zac1 (blue bars, n = 3).
Figure 4.
Figure 4.
Altered migratory properties of Zac1 overexpressing cortical cells. A–P, Biphoton time-lapse microscopy of E15.5 cortical slice cultures electroporated with pCIG2 and pCIG2–Zac1. A, B, Photomicrographs of GFP+ cells imaged 30 h after electroporation of pCIG2 (A) and pCIG2–Zac1 (B). C–E, Measurement of departure time defined as hours after transfection when GFP+ cells left the GZ and entered the IZ (C). Departure times for 195 pCIG2 (white bars) and 133 pCIG2–Zac1 (blue bars) transfected cells were recorded individually (D) and averaged (E). F–H, Measurement of arrival time defined as hours after transfection when GFP+ entered the CP (F). Arrival times for 195 pCIG2 (white bars) and 133 pCIG2–Zac1 (blue bars) transfected cells were recorded individually (G) and averaged (H). I, J, Measurement of total distance (micrometers) migrated for 195 pCIG2 (white bars) and 133 pCIG2–Zac1 (blue bars) transfected cells recorded individually (I) and averaged (J). K, L, Measurement of migration velocity (micrometers per hours) migrated for 195 pCIG2 (white bars) and 133 pCIG2–Zac1 (blue bars) transfected cells recorded individually (K) and averaged (L). M, N, Quantitation of pauses in migration defined as any movement <3.5 μm over 2 consecutive hours of recording for 195 pCIG2 (white bars) and 133 pCIG2–Zac1 (blue bars) individual transfected cells (M) and averaged (N). O, P, Quantitation of pause duration in hours for 195 pCIG2 (white bars) and 133 pCIG2–Zac1 (blue bars) individual transfected cells (O) and averaged (P).
Figure 5.
Figure 5.
Zac1 overexpression alters the morphology of migrating neurons. A–D, E14.5–E18.5 electroporations of pCIG2 (A, C; white bars) and pCIG2–Zac1 (B, D; blue bars). GFP+Tuj1+ neurons (A–D) were traced (A′–D′) in the IZ (A′, B′) and CP (C′, D′) from pCIG2 (n = 82 in IZ; n = 101 in CP) and pCIG2–Zac1 (n = 137 in IZ; n = 121 in CP) electroporations. E–I, Quantitation of percentage multipolar neurons in the IZ (E), percentage unipolar/bipolar neurons in the IZ (F), percentage neurons with neurites in the IZ (G), number of branches per neuron in the CP (H), and average number of branches in the CP (I). J, Schematic illustration of glial guided locomotion; saltatory movements begin with the centrosome, which is in front of the nucleus, and sends out microtubules to form a fork/cage around the nucleus (i). The leading process of the migrating neuron dilates and the centrosome enters (ii). Other organelles, such as the Golgi apparatus and ER, enter the dilated leading process (iii). Finally, microtubules attached to the centrosome pull the nucleus into the dilation (iv). K–N, E14.5–E18.5 coelectroporations of pCIG2 (K, K′, M, M′) or pCIG2–Zac1 (L, L′, N, N′) with RFP–CENT2 (K, K′, L, L′) or pEF/Myc/ER/mCherry (M, M′, N, N′). GFP+ cells were traced in K′–N′ to highlight the position of the organelles within the transfected cells. ns, Not significant.
Figure 6.
Figure 6.
Loss of Zac1 does not alter progenitor cell dynamics. A–I, Analysis of Pax6/BrdU (A, B) and Tbr2/BrdU (C, D) coexpression in E14.5 wild-type and Zac1 mutant (B) cortices after a 30 min BrdU pulse. DAPI labeling is blue counterstain. Quantitation of total number of Pax6+ cells (E), percentage Pax6+BrdU+/BrdU+ cells (F), total number of Tbr2+ cells (G), percentage Tbr2+BrdU+/BrdU+ cells (H), and total BrdU+ cells (I) in wild-type (n = 3; white bars) and Zac1 mutants (n = 3; blue bars). J–P, Analysis of Pax6/BrdU (J, K) and Tbr2/Brdu (L, M) coexpression in E15.5 wild-type (L) and Zac1 mutant (M) cortices after a 24 h BrdU pulse. DAPI labeling is blue counterstain. Quantitation of the percentage Pax6+BrdU+/BrdU+ cells (N), percentage Tbr2+BrdU+/BrdU+ cells (O), and total BrdU+ cells (P) in wild types (n = 3; white bars) and Zac1 mutants (n = 3; blue bars).
Figure 7.
Figure 7.
Aberrant distribution of laminar markers in Zac1 mutant cortices. A–C, E14.5–E18.5 BrdU birthdating in wild-type (A–A″) and Zac1 mutant (B–B″) cortices. Distribution of BrdU-labeled cortical neurons divided into 13 bins corresponding to upper CP layers (bins 10–13), deep CP layers (bins 5–9), IZ (bins 3–4), and GZ (bins 1–2) in wild-type (white bars; n = 3) and Zac1 mutant (blue bars; n = 3) cortices (C). D–N, E18.5 wild-type (D, D′, H, H′, L, L′) and Zac1 mutant (E, E′, I, I′, M, M′) cortices immunostained for Beta3 (D, D′, E, E′), Cux1 (H, H′, I, I′), and Ctip2 (L, L′, M, M′). DAPI labeling is blue counterstain. Quantitation of percentage Beta3+/DAPI+ cells in total (F) and in each layer (G), percentage Cux1+/DAPI+ cells in total (J) and in each layer (K), and percentage Ctip2+/DAPI+ cells in total (N) and in each layer (O) for wild types (n = 3; white bars) and Zac1 mutants (n = 3; blue bars).
Figure 8.
Figure 8.
Aberrant morphology of migrating neurons in Zac1 mutant cortices. A, Western blot analysis of Zac1 and β-actin protein levels in NIH-3T3 cells cotransfected with pCIG2–Zac1 along with different shRNA constructs. B–D, E14.5–E18.5 electroporations of sh-scrambled control (B) and shZac1 vectors (C) in wild-type CD1 timed pregnant females. Quantitation of percentage GFP+ cells/layer for sh-scrambled (n = 3; white bars) and shZac1 (n = 3; blue bars) (D). E, F, E14.5–E18.5 electroporations of Zac1 mutant cortices with sh-scrambled and sh-Zac1 constructs. G–I, E14.5–E18.5 electroporation of pCIG2 in wild-type (G) and Zac1 mutant (H) cortices. Quantitation of percentage GFP+ cells in each layer for wild-type (n = 3; white bars) and Zac1 mutant (n = 3; blue bars) cortices (I). J–P, E14.5–E18.5 electroporation of pCIG2 in wild-type (J, L) and Zac1 mutant (K, M) cortices, with images taken in the IZ (J, K) and CP (L, M). GFP+Tuj1+ neurons in wild-type IZ (J′) and CP (L′) and in Zac1+m/− IZ (K′) and CP (M′) were traced. Quantitation of percentage multipolar neurons in IZ of wild-type (n = 86; white bars) and Zac1 mutant (n = 71; blue bars) cortices (N). Quantitation of percentage neurons with neurites in the IZ of wild-type (n = 86; white bars) and Zac1 mutant (n = 71; blue bars) cortices (O). Quantitation of the number of branches in the CP of wild-type (n = 82; white bars) and Zac1 mutant (n = 100; blue bars) cortices (P). DL, Deep layer; UL, upper layer.
Figure 9.
Figure 9.
Zac1 regulates neuronal migration by regulating Pac1 transcription in the developing neocortex. A–D, Schematic of the experimental design to test whether Zac1 regulates the expression of Pac1 in E15.5 Zac1+m/− cortices (A) and in E13.5–E14.5 Zac1 gain-of-function assays (C). Quantitation of qPCR data, showing reduced Pac1 transcript levels in Zac1+m/− cortices [n = 4 for both wild-type (white bars) and Zac1 mutant (blue bars); B] and increased Pac1 transcript levels after Zac1 misexpression [n = 6 for both pCIG2 (white bars) and pCIG2–Zac1 (blue bars); D]. E–G, E14.5–E18.5 electroporations of pCIG2 (E) and pCIG2-Pac1 (F). Quantitation of percentage GFP+ cells in each layer for pCIG2 control (n = 3; white bar) and pCIG2–Pac1 (n = 3; blue bar) (G). H–J, E14.5–E18.5 electroporations of sh-scrambled (H) and shPac1 (I). Quantitation of percentage GFP+ cells in each layer for pCIG2 control (n = 3; white bar) and shPac1 (n = 3; blue bar) (J). K–R, E14.5–E18.5 electroporations of pCIG2 (K, M) and pCIG2–Pac1 (L, N), showing coimmunolabeling of GFP (green) and Tuj1 (red). Blue is DAPI counterstain. Tracing of GFP+Tuj1+ neurons in the IZ from pCIG2 control (n = 82; K′) and pCIG2–Pac1 (n = 93; L′) electroporations. Quantitation of percentage multipolar cells (O), percentage cells with neurites (P), and percentage unipolar or bipolar neurons (Q) for pCIG2 control (n = 3; white bars) and pCIG2–Pac1 (n = 3; blue bars). Tracing of GFP+Tuj1+ neurons in the CP from pCIG2 control (n = 101; M′) and pCIG2–Pac1 (n = 23; N′) electroporations. Quantitation of average number of branches per neuron in the CP (R). S–V, E14.5–E18.5 electroporations of sh-scrambled (S) and shPac1 (T), showing coimmunolabeling of GFP (green) and Tuj1 (red). Blue is DAPI counterstain. Tracing of GFP+Tuj1+ neurons in the IZ from pCIG2 control (n = 82; S′) and shPac1 (n = 87; T′). Quantitation of percentage multipolar neurons (U) and percentage unipolar or bipolar neurons (V) for sh-scrambled (n = 3; white bars) and shZac1 (n = 3; blue bars).
Figure 10.
Figure 10.
Zac1 regulates neuronal migration via Pac1 in the developing neocortex. A, Schematic representation of method used to calculate migration index. B–F, E14.5–E18.5 electroporations of pCIG2 (B), pCIG2–Zac1 (C), pCIG2–Pac1 (D), sh-scrambled (E), shZac1 (F), shPac1 (G), pCIG2–Zac1 plus shPac1 (H), and shZac1 plus pCIG2–Pac1 (I). J, Quantitation of migration indices for all electroporations. K, Summary of regulatory interactions between Zac1 and Pac1. Zac1 gain-of-function perturbs radial migration even when Pac1 is knocked down, suggesting that Zac1 controls the expression of other migratory factors. Zac1 knockdown no longer perturbs migration when Pac1 is overexpressed, suggesting that Pac1 is the most critical regulator of migration downstream of Zac1. L, Summary of the role of Zac1 in guiding neuronal migration in the developing neocortex. At the end of glial guided locomotion (steps i–iv), neurons detach from the radial glial scaffold and the leading process extends multiple branches that arborize to the pial surface (step v in pCIG2 control). In neurons in which Zac1 expression is deregulated, branching of the leading process does not occur at the end of terminal translocation (step v; + or − Zac1).

References

    1. Abdollahi A. LOT1 (ZAC1/PLAGL1) and its family members: mechanisms and functions. J Cell Physiol. 2007;210:16–25. doi: 10.1002/jcp.20835. - DOI - PubMed
    1. Alam S, Zinyk D, Ma L, Schuurmans C. Members of the Plag gene family are expressed in complementary and overlapping regions in the developing murine nervous system. Dev Dyn. 2005;234:772–782. doi: 10.1002/dvdy.20577. - DOI - PubMed
    1. Allais A, Burel D, Isaac ER, Gray SL, Basille M, Ravni A, Sherwood NM, Vaudry H, Gonzalez BJ. Altered cerebellar development in mice lacking pituitary adenylate cyclase-activating polypeptide. Eur J Neurosci. 2007;25:2604–2618. doi: 10.1111/j.1460-9568.2007.05535.x. - DOI - PubMed
    1. Anderson AA, Helmering J, Juan T, Li CM, McCormick J, Graham M, Baker DM, Damore MA, Véniant MM, Lloyd DJ. Pancreatic islet expression profiling in diabetes-prone C57BLKS/J mice reveals transcriptional differences contributed by DBA loci, including Plagl1 and Nnt. Pathogenetics. 2009;2:1. doi: 10.1186/1755-8417-2-1. - DOI - PMC - PubMed
    1. Arima T, Wake N. Establishment of the primary imprint of the HYMAI/PLAGL1 imprint control region during oogenesis. Cytogenet Genome Res. 2006;113:247–252. doi: 10.1159/000090839. - DOI - PubMed

Publication types

MeSH terms

Substances

LinkOut - more resources