Quantitative evaluation of cell death response in vitro and in vivo using conventional-frequency ultrasound
- PMID: 26425663
- PMCID: PMC4580065
- DOI: 10.18632/oncoscience.235
Quantitative evaluation of cell death response in vitro and in vivo using conventional-frequency ultrasound
Abstract
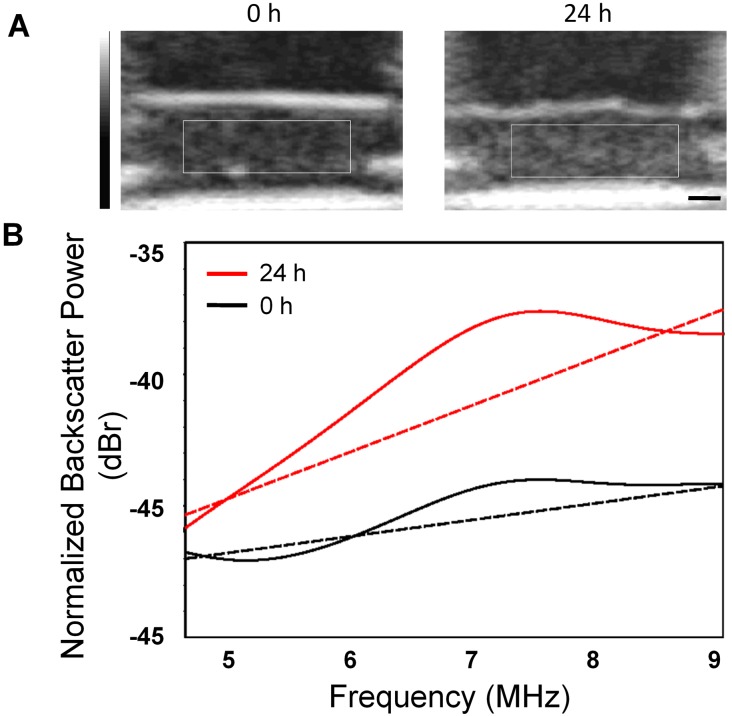
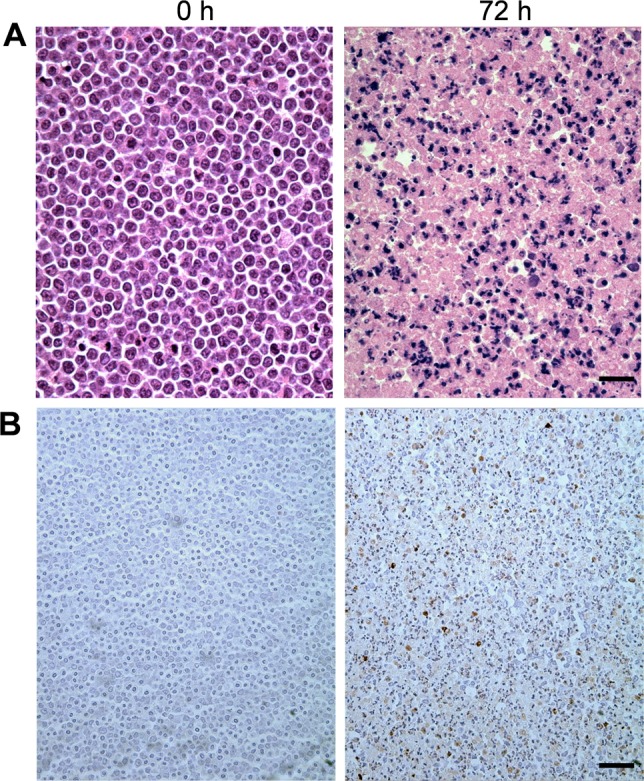
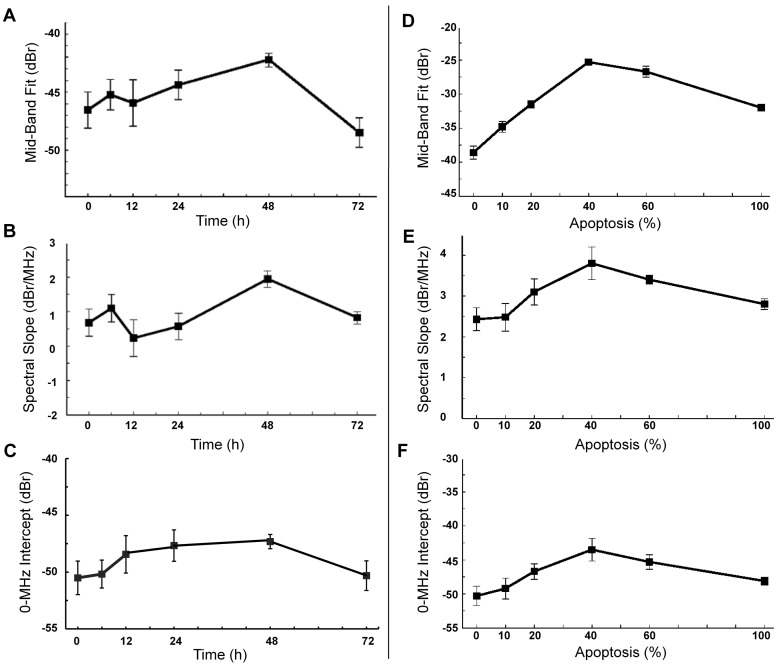
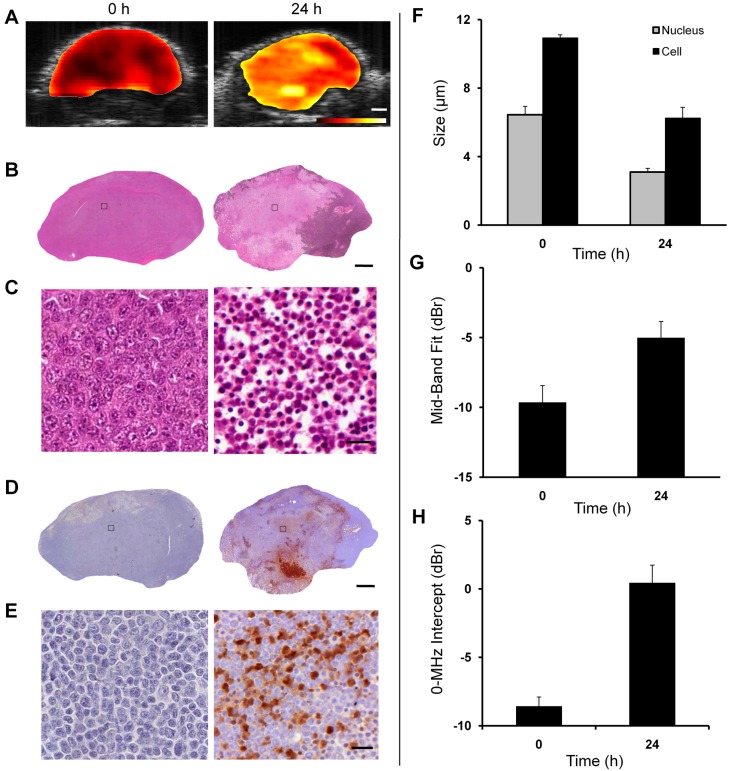
Previous studies using high-frequency ultrasound have suggested that radiofrequency (RF) spectral analysis can be used to quantify changes in cell morphology to detect cell death response to therapy non-invasively. The study here investigated this at conventional-frequencies, frequently used in clinical settings. Spectral analysis was performed using ultrasound RF data collected with a clinical ultrasound platform. Acute myeloid leukemia (AML-5) cells were exposed to cisplatinum for 0-72 hours in vitro and prepared for ultrasound data collection. Preclinical in vivo experiments were also performed on AML-5 tumour-bearing mice receiving chemotherapy. The mid-band fit (MBF) spectral parameter demonstrated an increase of 4.4 ± 1.5 dBr for in vitro samples assessed 48 hours after treatment, a statistically significant change (p < 0.05) compared to control. Further, in vitro concentration-based analysis of a mixture of apoptotic and untreated cells indicated a mean change of 10.9 ± 2.4 dBr in MBF between 0% and 40% apoptotic cell mixtures. Similar effects were reproduced in vivo with an increase of 4.6 ± 0.3 dBr in MBF compared to control, for tumours with considerable apoptotic areas within histological samples. The alterations in the size of cells and nuclei corresponded well with changes measured in the quantitative ultrasound (QUS) parameters.
Keywords: apoptosis; cancer therapy; personalized medicine; quantitative ultrasound; treatment response monitoring.
Conflict of interest statement
The authors declare no conflict of interest related to this work.
Figures

Similar articles
-
Implementation of Non-Invasive Quantitative Ultrasound in Clinical Cancer Imaging.Cancers (Basel). 2022 Dec 16;14(24):6217. doi: 10.3390/cancers14246217. Cancers (Basel). 2022. PMID: 36551702 Free PMC article. Review.
-
Quantitative ultrasound imaging of therapy response in bladder cancer in vivo.Oncoscience. 2016 Apr 18;3(3-4):122-33. doi: 10.18632/oncoscience.302. eCollection 2016. Oncoscience. 2016. PMID: 27226985 Free PMC article.
-
High-frequency ultrasound detection of cell death: Spectral differentiation of different forms of cell death in vitro.Oncoscience. 2016 Sep 12;3(9-10):275-287. doi: 10.18632/oncoscience.319. eCollection 2016. Oncoscience. 2016. PMID: 28050578 Free PMC article.
-
Quantitative ultrasound characterization of therapy response in prostate cancer in vivo.Am J Transl Res. 2021 May 15;13(5):4437-4449. eCollection 2021. Am J Transl Res. 2021. PMID: 34150025 Free PMC article.
-
[Biological properties and sensitivity to induction therapy of differentiated cells expressing atypical immunophenotype in acute leukemia of children].Folia Med Cracov. 2001;42(3):5-80. Folia Med Cracov. 2001. PMID: 12353422 Review. Polish.
Cited by
-
Effect of chromatin structure on quantitative ultrasound parameters.Oncotarget. 2017 Mar 21;8(12):19631-19644. doi: 10.18632/oncotarget.14816. Oncotarget. 2017. PMID: 28129644 Free PMC article.
-
Quantitative Ultrasound for Evaluation of Tumour Response to Ultrasound-Microbubbles and Hyperthermia.Technol Cancer Res Treat. 2023 Jan-Dec;22:15330338231200993. doi: 10.1177/15330338231200993. Technol Cancer Res Treat. 2023. PMID: 37750232 Free PMC article.
-
Apriori prediction of chemotherapy response in locally advanced breast cancer patients using CT imaging and deep learning: transformer versus transfer learning.Front Oncol. 2024 May 2;14:1359148. doi: 10.3389/fonc.2024.1359148. eCollection 2024. Front Oncol. 2024. PMID: 38756659 Free PMC article.
-
Implementation of Non-Invasive Quantitative Ultrasound in Clinical Cancer Imaging.Cancers (Basel). 2022 Dec 16;14(24):6217. doi: 10.3390/cancers14246217. Cancers (Basel). 2022. PMID: 36551702 Free PMC article. Review.
-
Current trends in luminescence-based assessment of apoptosis.RSC Adv. 2023 Oct 30;13(45):31641-31658. doi: 10.1039/d3ra05809c. eCollection 2023 Oct 26. RSC Adv. 2023. PMID: 37908656 Free PMC article. Review.
References
-
- Brindle K. New approaches for imaging tumour responses to treatment. Nat Rev Cancer. 2008;8:94–107. - PubMed
-
- Kolios MC, Czarnota GJ. Potential use of ultrasound for the detection of cell changes in cancer treatment. Futur Oncol. 2009;5:1527–32. - PubMed
-
- Czarnota GJ, Kolios MC. Ultrasound detection of cell death. Imaging Med. 2010;2:17–28.
-
- Sadeghi-Naini A, Falou O, Hudson JM, Bailey C, Burns PN, Yaffe MJ, Stanisz GJ, Kolios MC, Czarnota GJ. Imaging innovations for cancer therapy response monitoring. Imaging Med. 2012;4:311–27.
LinkOut - more resources
Full Text Sources
Other Literature Sources