Clinical Trial
. 2015 Jul 10;2(8):968-84.
doi: 10.1016/j.ebiom.2015.07.007. eCollection 2015 Aug.

Dietary Modulation of Gut Microbiota Contributes to Alleviation of Both Genetic and Simple Obesity in Children

Affiliations
Clinical Trial

Dietary Modulation of Gut Microbiota Contributes to Alleviation of Both Genetic and Simple Obesity in Children

Chenhong Zhang et al. EBioMedicine. .

Abstract

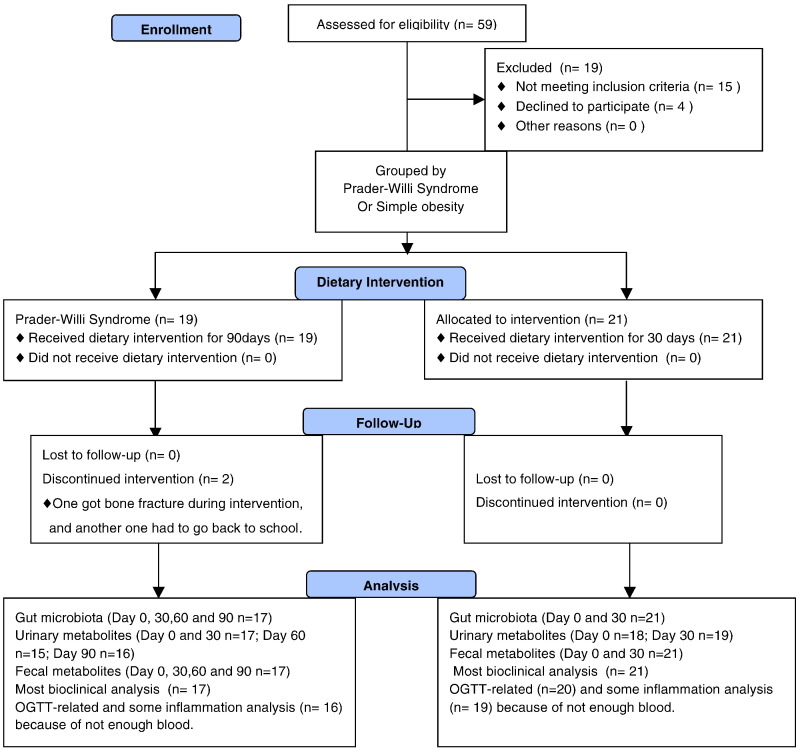
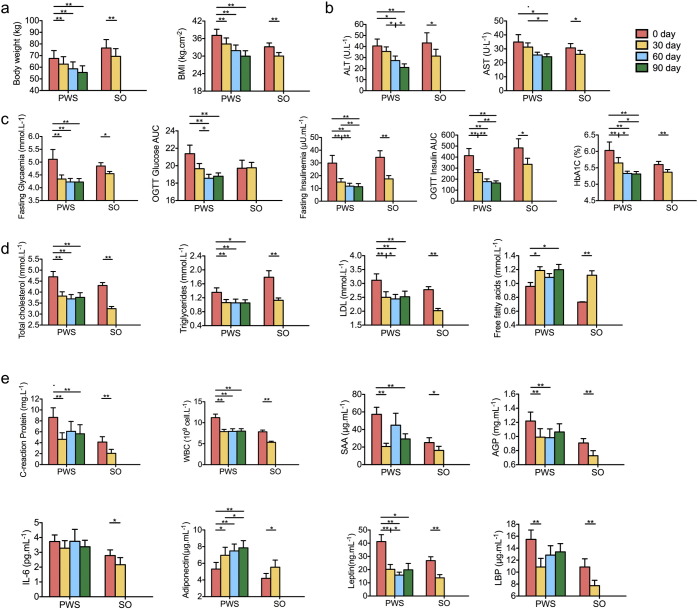
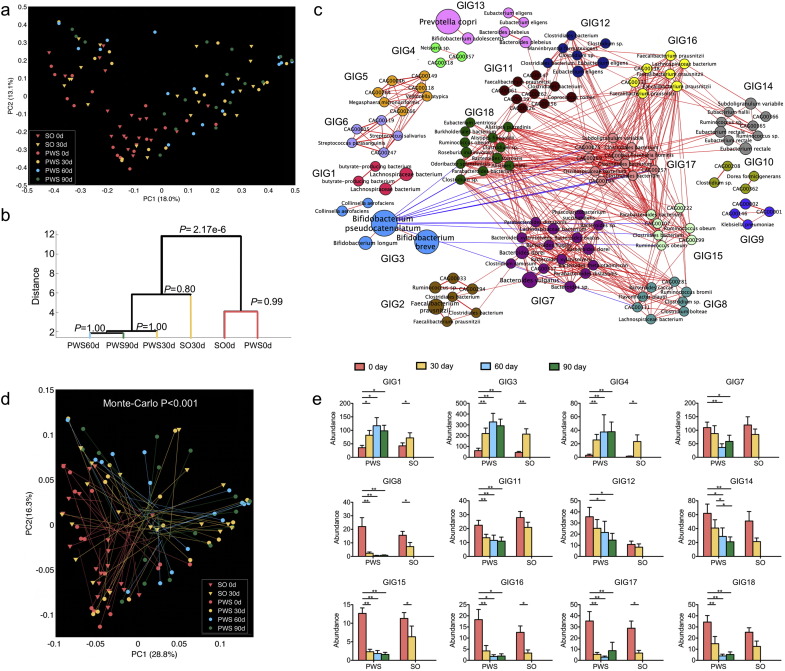
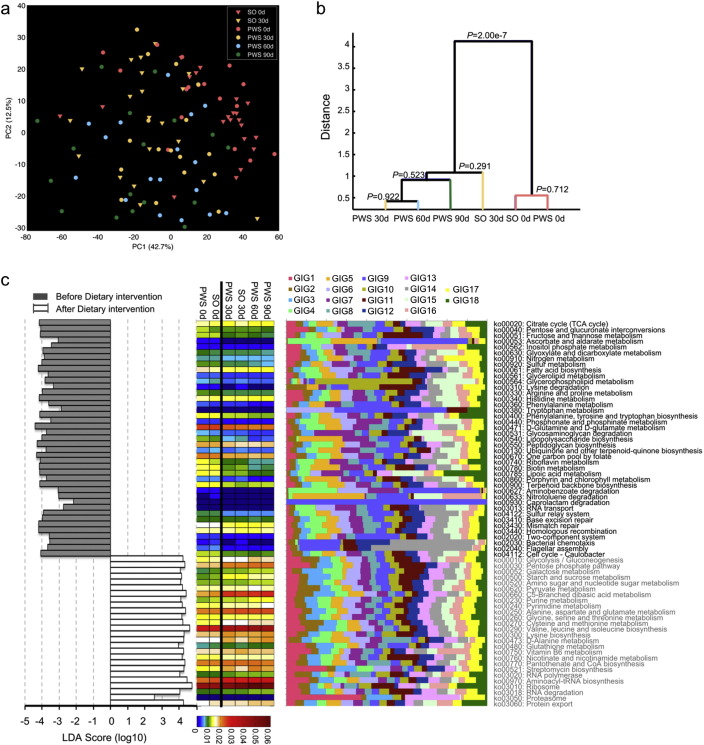
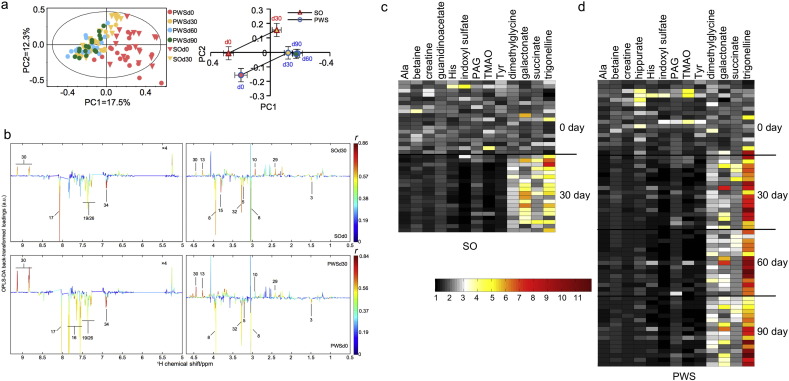
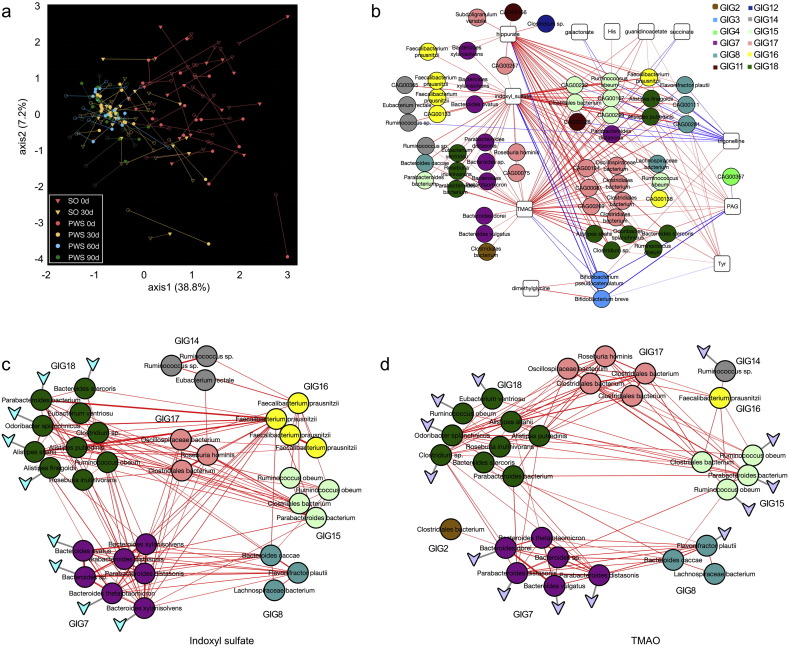
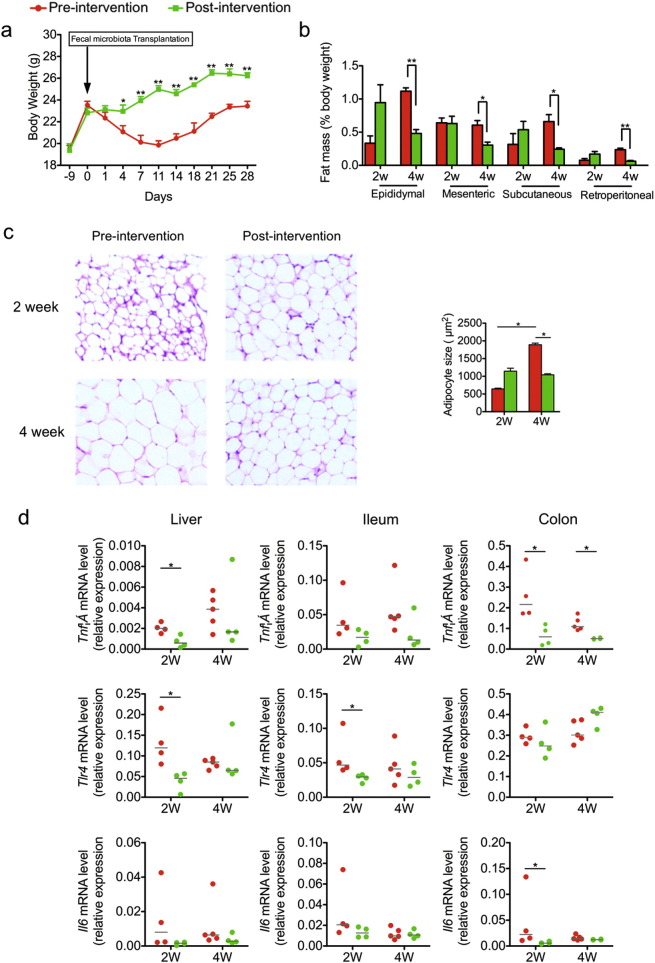
Gut microbiota has been implicated as a pivotal contributing factor in diet-related obesity; however, its role in development of disease phenotypes in human genetic obesity such as Prader-Willi syndrome (PWS) remains elusive. In this hospitalized intervention trial with PWS (n = 17) and simple obesity (n = 21) children, a diet rich in non-digestible carbohydrates induced significant weight loss and concomitant structural changes of the gut microbiota together with reduction of serum antigen load and alleviation of inflammation. Co-abundance network analysis of 161 prevalent bacterial draft genomes assembled directly from metagenomic datasets showed relative increase of functional genome groups for acetate production from carbohydrates fermentation. NMR-based metabolomic profiling of urine showed diet-induced overall changes of host metabotypes and identified significantly reduced trimethylamine N-oxide and indoxyl sulfate, host-bacteria co-metabolites known to induce metabolic deteriorations. Specific bacterial genomes that were correlated with urine levels of these detrimental co-metabolites were found to encode enzyme genes for production of their precursors by fermentation of choline or tryptophan in the gut. When transplanted into germ-free mice, the pre-intervention gut microbiota induced higher inflammation and larger adipocytes compared with the post-intervention microbiota from the same volunteer. Our multi-omics-based systems analysis indicates a significant etiological contribution of dysbiotic gut microbiota to both genetic and simple obesity in children, implicating a potentially effective target for alleviation.

Research in context: Poorly managed diet and genetic mutations are the two primary driving forces behind the devastating epidemic of obesity-related diseases. Lack of understanding of the molecular chain of causation between the driving forces and the disease endpoints retards progress in prevention and treatment of the diseases. We found that children genetically obese with Prader-Willi syndrome shared a similar dysbiosis in their gut microbiota with those having diet-related obesity. A diet rich in non-digestible but fermentable carbohydrates significantly promoted beneficial groups of bacteria and reduced toxin-producers, which contributes to the alleviation of metabolic deteriorations in obesity regardless of the primary driving forces.

Keywords: Genome interaction network; Gut microbiota; Metabolomics; Metagenomics; Obesity; Prader–Willi syndrome.


Figures

Fig. 1
Fig. 1
The flow diagram of participants.
Fig. 2
Fig. 2
Improved bioclinical parameters and inflammatory conditions after the intervention. (a) Anthropometric markers. (b) Hepatic function markers. (c) Plasma glucose homeostasis. (d) Plasma lipid homeostasis. (e) Inflammation related markers. Data are shown as mean ± s.e.m. Wilcoxon matched-pairs signed rank test (two-tailed) was used to analyze variation between each two-time points in PWS or SO children. *P < 0.05, **P < 0.01. For most of the bioclinical variables, PWS n = 17 and SO n = 21; For OGTT Glycaemia AUC and OGTT Insulinemia AUC, PWS n = 16 and SO n = 20; For CRP, W.B.C., SAA, AGP, Adiponectin and IL-6, PWS n = 16 and SO n = 19. BMI: body mass index; ALT: Alanine aminotransferase; AST: Aspartate aminotransferase; OGTT: Oral glucose tolerance test; LDL: low-density lipoprotein; CRP: C reactive protein; W.B.C.: White blood cell count; SAA: serum amyloid A protein; AGP: α-acid glycoprotein; LBP: Lipopolysaccharide binding protein.
Fig. 3
Fig. 3
Concordance of structural shifts of gut microbiota and the improvement of the host metabolic health. (a) PCoA based on Bray–Curtis distance of all the 376 bacterial CAGs during the dietary intervention. (b) Clustering of gut microbiota based on distances between different groups calculated with MANOVA test of first 23 PCs (accounting for 80% of total variations) of PCoA based on Bray–Curtis distance of all bacterial CAGs. (c) Genome interaction groups interaction network. Network plot highlights correlation relationships between 18 GIGs of 161 prevalent bacterial CAGs at all time points from the two cohorts. Node size indicates the average abundance of the species/strains. Lines between nodes represent correlations between the nodes they connect, with line width indicating the correlation magnitude, and red and blue colors indicating positive and negative correlations, respectively. For clarity, only lines corresponding to correlations whose magnitude is greater than 0.5 are drawn, and unconnected nodes are omitted. (d) Procrustes analysis combining PCoA of GIGs (end of lines with solid symbols) with PCA of bioclinical variables presented in Fig. 1 (end of lines without solid symbols). For PWS, n = 17 at Day 0, 30, 60, and 90; For SO, n = 21 at Day 0 and n = 20 at Day 30. (e) Group level abundance shifts of GIGs that changed significantly during dietary intervention. Data are mean ± s.e.m. Wilcoxon matched-pairs signed rank test (two-tailed) was used to analyze variation between each two-time points in PWS or SO children. *P < 0.05, **P < 0.01.
Fig. 4
Fig. 4
Functional shifts of the gut microbiome during the dietary intervention. (a) The PCA score plot of the KO Groups recognized with HUMAnN showing a significant shift of the KO profiles after the intervention (log-transformed). (b) Clustering of KO profiles based on distances between different groups calculated with MANOVA test of the first five PCs of PCA of KO. (c) Key pathways of gut microbiota responding to dietary intervention. The left histogram shows the LDA scores computed for features (on the pathway level) differentially abundant between all samples before and after the intervention. The heat map shows the abundance of the key pathways. The stacked bar chart shows relative contribution of GIGs to each pathway. For PWS, n = 17 at Day 0, 30, 60, and 90; For SO, n = 21 at Day 0 and n = 20 at Day 30. In (c) day 0 and day 30 data of PWS and SO combined together for this analysis.
Fig. 5
Fig. 5
Altered profiles of urinary metabolites during the dietary intervention. (a) PCA score plot of urinary metabolite profiles obtained from SO and PWS groups during the dietary intervention (left) and the metabolic trajectories generated from the PCA score plot. (b) Validated OPLS-DA coefficient plots showing the alterations of metabolic profiles in the urine caused by the 30-day intervention. The plot related to the discrimination between 1H NMR spectra of urine from Day 0 and Day 30 of SO (top) groups (n = 17, r > 0.468, P < 0.05). Plot related to the discrimination between 1H NMR spectra of urine from Day 0 and Day 30 of the PWS groups (n = 17, r > 0.468, P < 0.05). See Table S14 for the metabolite identification key. (c) Heat map showing significantly changed metabolites after the 30-day intervention in the SO cohort. (d) Heat map showing the significantly changed metabolites after 30-, 60- and 90-day interventions in the PWS cohort. The significance of each statistical comparison is shown in Fig. S31.
Fig. 6
Fig. 6
Changes of co-metabolism between host and gut microbiota. (a) Co-inertia analysis (CIA) of relationships between the metabolomics PCA (end of lines with empty symbol) and microbiota CAGs PCA (end of lines with solid symbol). (b) Bacterial CAGs significantly associated with the key metabolites modulated by the intervention. The bootstrapped Spearman correlation coefficient between the 161 prevalent bacterial CAGs and the key metabolites was more than 0.4 and FDR < 0.001. Lines between nodes represent correlations between the nodes they connect, with line width indicating the correlation magnitude, and red and blue colors indicating positive and negative correlations, respectively. (c) Species interaction network of the bacterial CAGs significantly associated with indoxyl sulfate. Only the bacterial CAGs with high quality draft genomes are shown here. Lines between nodes represent correlations between the nodes they connect, with line width indicating the correlation magnitude, and red colors indicating positive correlations. The triangle represents the presence of the tryptophanase gene. (d) Species interaction network of the bacterial CAGs significantly associated with TMAO. Only the bacterial CAGs with high quality draft genomes are shown here. Lines between nodes represent correlations between the nodes they connect, with line width indicating the correlation magnitude, and red colors indicating positive correlations. The triangle represents the presence of the gene cluster encoding choline TMA-lyase and choline TMA-lyase-activating enzyme.
Fig. 7
Fig. 7
Impaired metabolism of gnotobiotic mice transplanted with pre-intervention gut microbiota from a PWS patient. (a) Body weight curves of gnotobiotic mice receiving the fecal microbiota from GD58 before (Day 0, red) and after (Day 90, green) the intervention. For mice receiving pre-intervention microbiota, 1 to 14 days after transplantation, n = 10, and 15 to 28 days, n = 5; For mice receiving post-intervention microbiota, 1 to 14 days after transplantation, n = 9, and 15 to 28 days, n = 4. (b) Adiposity index (%Fat mass/body weight) of gnotobiotic mice at 2 and 4 weeks after fecal transplantation. (c) Hematoxylin- and eosin-stained sections of epididymal fat pads (100 × magnification). Cell area of adipocyte in epididymal fat pad is shown as mean ± s.e.m. (d) RT-qPCR analysis of expression of Tnfα, Tlr4 and Il6 in the liver, ileum and colon. All mRNA quantification data were normalized to the housekeeping gene Glyceraldehyde-3-phosphate dehydrogenase (Gapdh). Gene expression levels are normalized to that of mice 2 weeks after inoculation with pre-intervention microbiota. The median of the data in each group is shown. Student t-test (two-tailed, in (a), (b) and (c)) or Mann–Whitney U test (two-tailed, in (d),) was used to analyze variation between gnotobiotic mice receiving pre- and post-intervention microbiota. *P < 0.05, **P < 0.01. In (b) to (d), for mice receiving pre-intervention microbiota, n = 5; for mice receiving post-intervention microbiota, n = 4.

Comment in

  • Getting Healthier Through Microbiome Makeover.
    [No authors listed] [No authors listed] EBioMedicine. 2015 Aug 14;2(8):771. doi: 10.1016/j.ebiom.2015.08.024. eCollection 2015 Aug. EBioMedicine. 2015. PMID: 26425669 Free PMC article. No abstract available.

References

    1. Abubucker S., Segata N., Goll J. Metabolic reconstruction for metagenomic data and its application to the human microbiome. PLoS Comput. Biol. 2012;8(6):e1002358. - PMC - PubMed
    1. Askree S.H., Hjelm L.N., Pervaiz M.A. Allelic dropout can cause false-positive results for Prader–Willi and Angelman syndrome testing. J. Mol. Diagn. 2011;13(1):108–112. - PMC - PubMed
    1. Backhed F., Ding H., Wang T. The gut microbiota as an environmental factor that regulates fat storage. Proc. Natl. Acad. Sci. U. S. A. 2004;101(44):15718–15723. - PMC - PubMed
    1. Backhed F., Manchester J.K., Semenkovich C.F., Gordon J.I. Mechanisms underlying the resistance to diet-induced obesity in germ-free mice. Proc. Natl. Acad. Sci. U. S. A. 2007;104(3):979–984. - PMC - PubMed
    1. Barreto F.C., Barreto D.V., Liabeuf S. Serum indoxyl sulfate is associated with vascular disease and mortality in chronic kidney disease patients. Clin. J. Am. Soc. Nephrol. 2009;4(10):1551–1558. - PMC - PubMed

Publication types