. 2015 Nov;109(5):399-413.
doi: 10.1097/HP.0000000000000356.

The Delayed Effects of Acute Radiation Syndrome: Evidence of Long-Term Functional Changes in the Clonogenic Cells of the Small Intestine

Affiliations

The Delayed Effects of Acute Radiation Syndrome: Evidence of Long-Term Functional Changes in the Clonogenic Cells of the Small Intestine

Catherine Booth et al. Health Phys. 2015 Nov.

Abstract

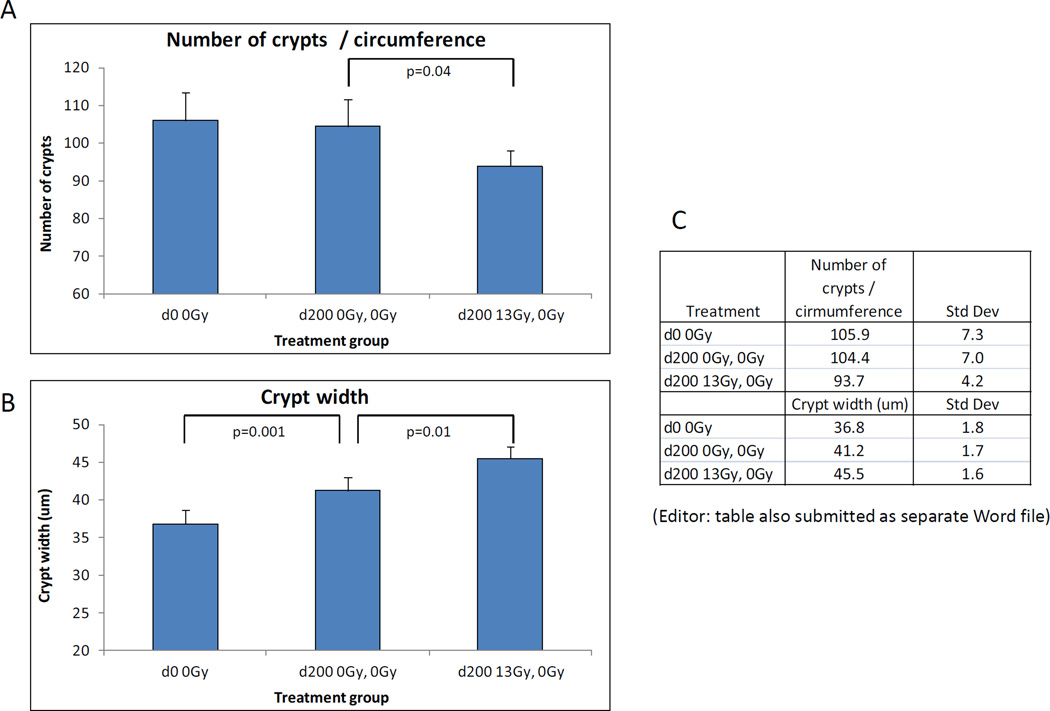
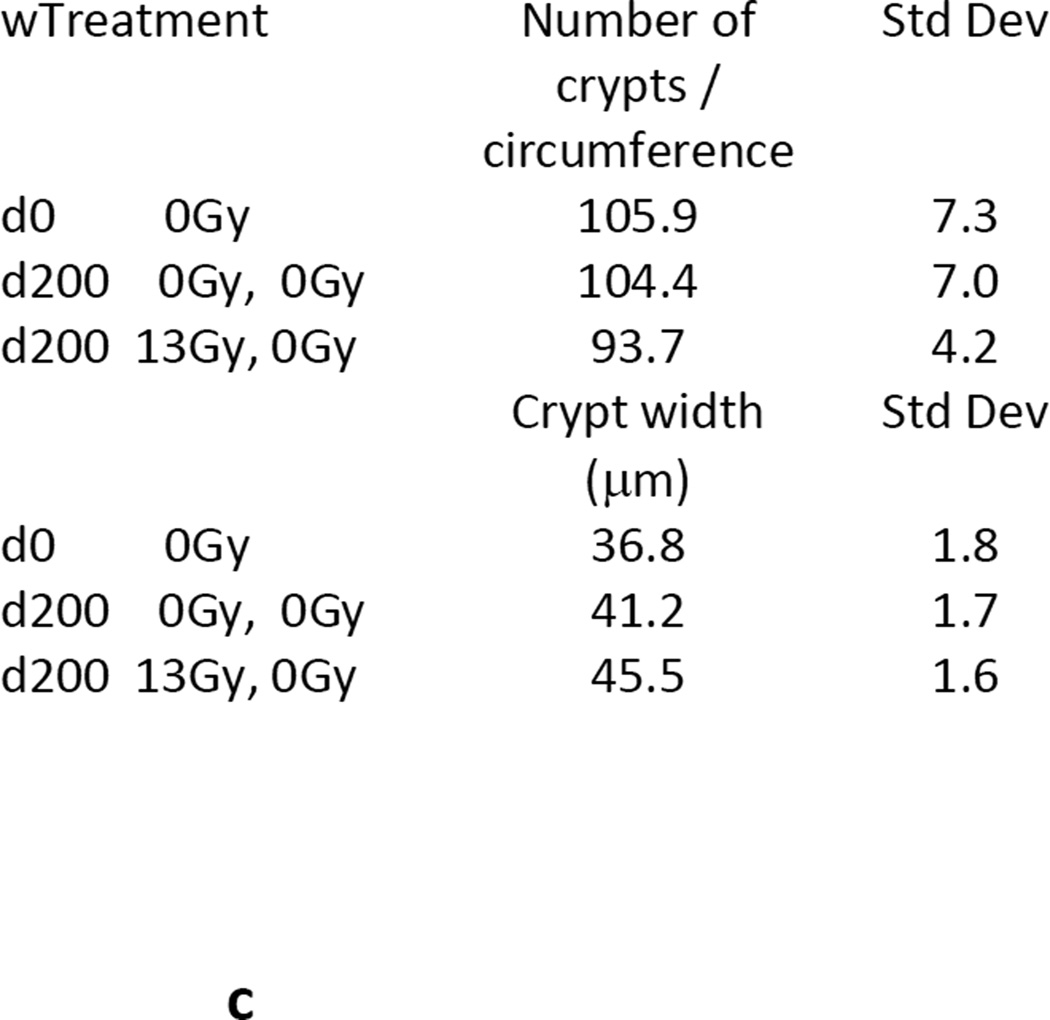
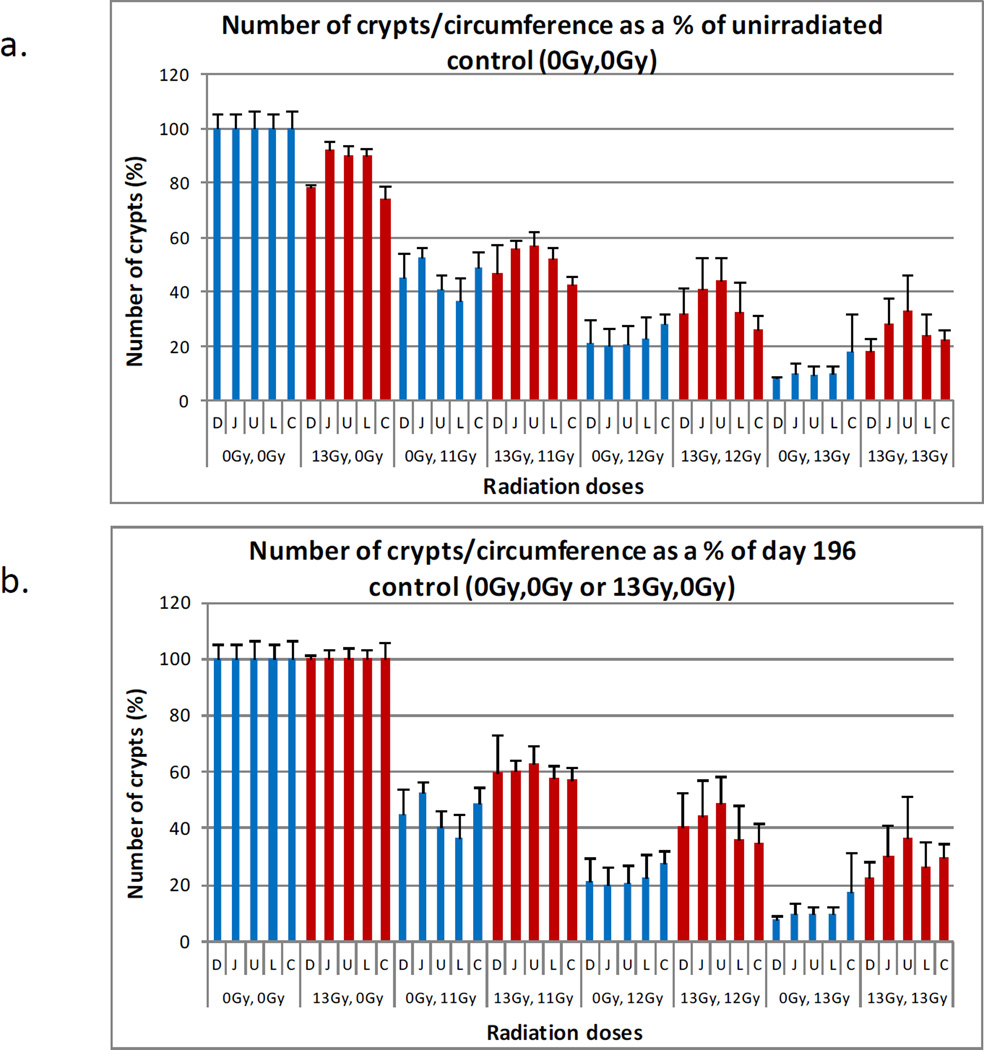
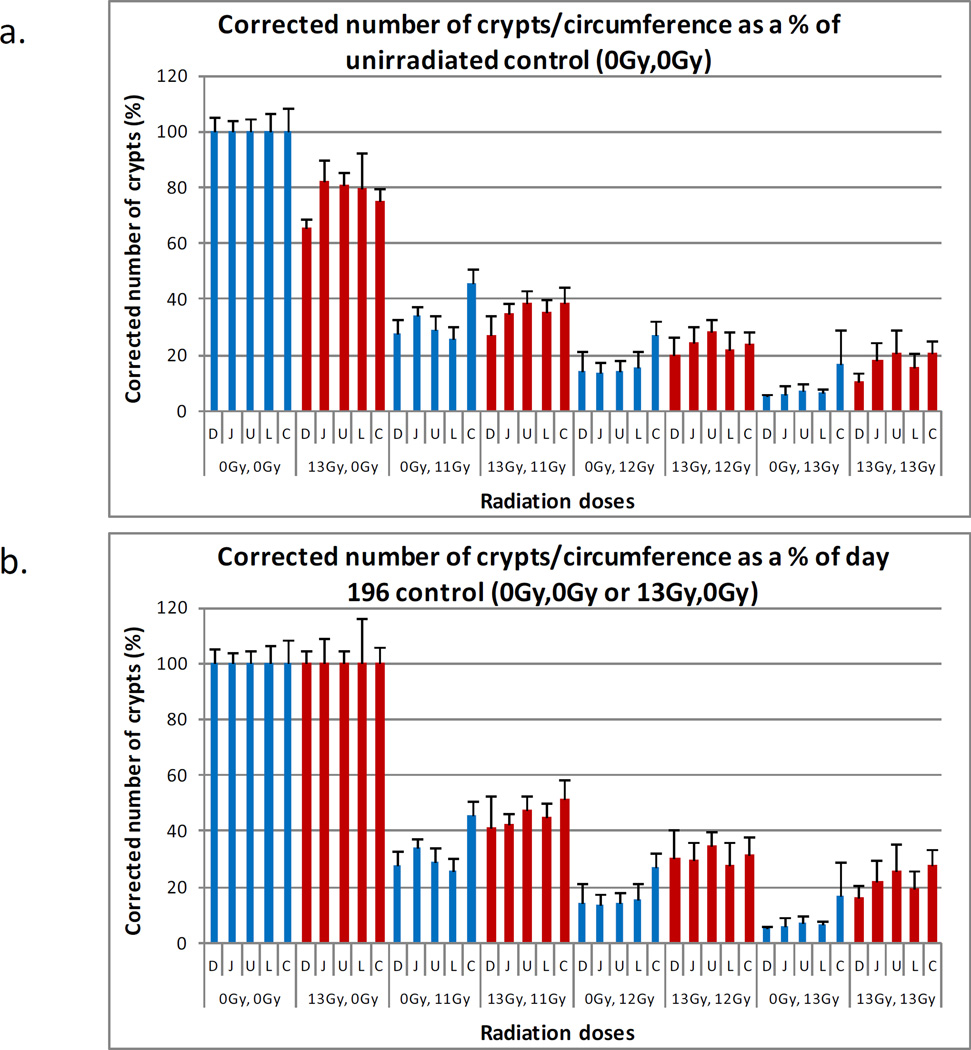
Long term or residual damage post-irradiation has been described for many tissues. In hematopoietic stem cells (HSC), this is only revealed when the HSC are stressed and required to regenerate and repopulate a myeloablated host. Such an assay cannot be used to assess the recovery potential of previously irradiated intestinal stem cells (ISC) due to their incompatibility with transplantation. The best approximation to the HSC assay is the crypt microcolony assay, also based on clonogen survival. In the current study, the regenerative capacity of intestinal clonogenic cells in mice that had survived 13 Gy irradiation (with 5% bone marrow shielding to allow survival through the hematopoietic syndrome) and were then aged for 200 d was compared to previously unirradiated age-matched controls. Interestingly, at 200 d following 13 Gy, there remained a statistically significant reduction in crypts present in the various small intestinal regions (illustrating that the gastrointestinal epithelium had not fully recovered despite the 200-d interval). However, upon re-irradiation on day 196, those mice previously irradiated had improved crypt survival and regeneration compared to the age-matched controls. This was evident in all regions of the small intestine following 11-13 Gy re-exposure. Thus, there were either more clonogens per crypt within those previously irradiated and/or those that were present were more radioresistant (possibly because a subpopulation was more quiescent). This is contrary to the popular belief that previously irradiated animals may have an impaired/delayed regenerative response and be more radiosensitive.


Figures

Fig. 1
Fig. 1
Animal weights following 13 Gy irradiation, compared to controls (all groups pooled – controls n=36; irradiated n=24). a: Group Means b: Group Means + Std Dev. Following 13 Gy irradiation there is a dramatic loss of body weight within the first week of GI-ARS, followed by a gradual gain with inflection points reflecting the passage through the hematological radiation syndrome (H-ARS) and mild transient lung associated DEARE, in the presence of minimal bone marrow protection. Animals are then asymptomatic but remain at the original starting weight.
Fig. 2
Fig. 2
Mean group weights (g) from time of the 2nd irradiation on day 196. The table shows the mean weight per day, the plots the relative weight change. Groups of 6 mice received either no irradiation or 13 Gy when 10–12 weeks old, and then on day 196 a range of radiation doses. At the higher radiation doses the previously unirradiated mice lost more weight than those that had survived the prior irradiation, although since the starting weight was greater, the relative weight loss was less.
Fig. 3
Fig. 3
Mean blood counts + Std Dev in the irradiated animals. Blue bars indicate mice that were not irradiated when 10–12 weeks old, red bars are mice irradiated twice, initially with 13 Gy and then on day 196 (28 weeks later) with 11, 12 or 13 Gy (the top row of the X-axis indicates the day 0 treatment, the second row the day 196 treatment).
Fig. 4
Fig. 4
Comparison of crypt number and width on day 200 post-irradiation (38–40 weeks of age) to control 10–12 week old mice. d0 0 Gy = control 10–12 week mice; d200 0 Gy, 0 Gy = control 38–40 week mice; d200 13 Gy, 0 Gy = 38–40 week old mice previously irradiated with 13 Gy at 10–12 weeks. Illustration is data from the ileum (other regions follow the same pattern – data not shown).
Fig. 4
Fig. 4
Comparison of crypt number and width on day 200 post-irradiation (38–40 weeks of age) to control 10–12 week old mice. d0 0 Gy = control 10–12 week mice; d200 0 Gy, 0 Gy = control 38–40 week mice; d200 13 Gy, 0 Gy = 38–40 week old mice previously irradiated with 13 Gy at 10–12 weeks. Illustration is data from the ileum (other regions follow the same pattern – data not shown).
Fig. 5
Fig. 5
Example H & E images of the ileum (×10 objective). a: control, day 200 (38–40 weeks old). b: 38–40 weeks old, irradiated with 13 Gy at 10–12 weeks and then aged 200 days. c: 4 days following 11 Gy irradiation on day 196, mice previously unirradiated. d: 4 days following 11 Gy irradiation on day 196, mice previously irradiated with 13 Gy at 10–12weeks. e: 4 days following 12 Gy irradiation on day 196, mice previously unirradiated. f: 4 days following 12 Gy irradiation on day 196, mice previously irradiated with 13 Gy at 10–12weeks. g: 4 days following 13 Gy irradiation on day 196, mice previously unirradiated. h: 4 days following 13 Gy irradiation on day 196, mice previously irradiated with 13 Gy at 10–12weeks.
Fig. 6
Fig. 6
The mean number of crypts per intestinal circumference + Std Dev in the various regions of the gastrointestinal tract as a percentage of the day 0 (a) and day 196 (b) unirradiated controls. Blue bars indicate mice that were not irradiated when 10–12 weeks old, red bars are mice irradiated twice, initially with 13 Gy and then on day 196 with 11, 12 or 13 Gy. D=Duodenum, J=Jejunum, U=Upper Ileum, L=Lower Ileum and C=Midcolon.
Fig. 7
Fig. 7
Mean crypt width in all regions + Std Dev as a percentage of both the unirradiated control (a) and the day 196 unirradiated control (b). Blue bars indicate mice that were not irradiated when 10–12 weeks old, red bars are mice irradiated twice, initially with 13 Gy and then on day 196 with 11, 12 or 13 Gy. D=Duodenum, J=Jejunum, U=Upper Ileum, L=Lower Ileum and C=Midcolon.
Fig. 8
Fig. 8
Mean corrected crypt survival counts in all regions + Std Dev as a percentage of both the unirradiated control (a) and the day 196 unirradiated control (b). Blue bars indicate mice that were not irradiated when 10–12 weeks old, red bars are mice irradiated twice, initially with 13 Gy and then on day 196 with 11, 12 or 13 Gy. D=Duodenum, J=Jejunum, U=Upper Ileum, L=Lower Ileum and C=Midcolon.
Fig. 9
Fig. 9
Mean corrected crypt survival counts in whole small intestine + Std Dev as a percentage of both the unirradiated control (a) and the day 196 unirradiated control (b). Blue bars indicate mice that were not irradiated when 10–12 weeks old, red bars are mice irradiated twice, initially with 13 Gy and then on day 196 with 11, 12 or 13 Gy.

References

    1. Barker N, van Es JH, Kuipers J, Kujala P, van den Born M, Cozijnsen M, Haegebarth A, Korving J, Begthel H, Peters PJ, Clevers H. Identification of stem cells in small intestine and colon by marker gene Lgr5. Nature. 2007;449(7165):1003–1007. - PubMed
    1. Boggs DR. The total marrow mass of the mouse: a simplified method of measurement. Am J Hematol. 1984;16(3):277–286. - PubMed
    1. Booth C, Potten CS. Gut instincts: thoughts on intestinal epithelial stem cells. J Clin Invest. 2000;105(11):1493–1499. - PMC - PubMed
    1. Booth C, Tudor G, Tudor J, Katz BP, MacVittie TJ. Acute gastrointestinal syndrome in high-dose irradiated mice. Health Phys. 2012a;103(4):383–399. - PMC - PubMed
    1. Booth C, Tudor G, Tonge N, Shea-Donohue T, MacVittie TJ. Evidence of delayed gastrointestinal syndrome in high-dose irradiated mice. Health Phys. 2012b;103(4):400–410. - PMC - PubMed

Publication types

MeSH terms