Review
. 2015 Sep 20;5(4):1877-909.
doi: 10.1002/cphy.c140067.

Physiological Implications of Myocardial Scar Structure

Affiliations
Review

Physiological Implications of Myocardial Scar Structure

William J Richardson et al. Compr Physiol. .

Abstract

Once myocardium dies during a heart attack, it is replaced by scar tissue over the course of several weeks. The size, location, composition, structure, and mechanical properties of the healing scar are all critical determinants of the fate of patients who survive the initial infarction. While the central importance of scar structure in determining pump function and remodeling has long been recognized, it has proven remarkably difficult to design therapies that improve heart function or limit remodeling by modifying scar structure. Many exciting new therapies are under development, but predicting their long-term effects requires a detailed understanding of how infarct scar forms, how its properties impact left ventricular function and remodeling, and how changes in scar structure and properties feed back to affect not only heart mechanics but also electrical conduction, reflex hemodynamic compensations, and the ongoing process of scar formation itself. In this article, we outline the scar formation process following a myocardial infarction, discuss interpretation of standard measures of heart function in the setting of a healing infarct, then present implications of infarct scar geometry and structure for both mechanical and electrical function of the heart and summarize experiences to date with therapeutic interventions that aim to modify scar geometry and structure. One important conclusion that emerges from the studies reviewed here is that computational modeling is an essential tool for integrating the wealth of information required to understand this complex system and predict the impact of novel therapies on scar healing, heart function, and remodeling following myocardial infarction.


Figures

Figure 1
Figure 1
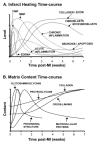
Wound healing after a myocardial infarction is a multi-faceted, dynamic process that results in the replacement of necrotic myocytes with collagenous scar tissue. A. This process is generally divided into 1) an early inflammatory phase characterized by pronounced chemical signaling, resorption of necrotic tissue, and recruitment of myofibroblasts, 2) a fibrotic phase characterized by increased myofibroblast number and collagen accumulation, and 3) a long-term remodeling phase characterized by collagen matrix stabilization and maturation. Panel A. adapted with permission from Jugdutt (127). B. Components of infarct scar matrix are highly dynamic during the healing time-course. Curves represent the fits of reported data, averaged across a number of small animal studies after grouping into the following categories: collagen (types I, III, IV, VI) (29, 36, 39, 73, 123, 175, 182, 189, 272, 277, 292, 300), collagen cross-links (hydroxylysylpyridinium, hydroxylysylpyridinoline) (73, 175, 272, 300), provisional structure (fibrin, fibronectin, laminin) (39, 58, 139, 162, 182), matricellular proteins (tenascin-C, thrombospondin, osteopontin, periostin, SPARC) (76, 119, 144, 162, 192, 194, 237, 263), glycosaminoglycans (hyaluronan) (58), and proteoglycans (biglycan, decorin) (62, 283, 291, 300).
Figure 2
Figure 2
Infarct collagen orientation depends on imaging plane. A. Infarcts are most often sectioned in the radial-circumferential (i.e., short-axis) plane, but fiber organization in the circumferential-longitudinal plane (parallel to the epicardium) is more relevant to scar mechanics. B. In the short-axis view, collagen fibers lie in planes parallel to the epicardium and appear to be circumferentially aligned even when the circumferential-longitudinal view (C) reveals them to be isotropic. Images are from 3-week old rat infarcts, sectioned, stained with picrosirius red, and imaged under polarized light. Reprinted with permission from Fomovsky (75).
Figure 3
Figure 3
Correlation between infarct mechanics and scar collagen structure in healing rat infarcts (75). A&B. Diagrams showing location of infarcts following permanent ligation or cryoinfarction to create infarcts with a range of shapes and locations: circular-apex (C-A), circular-midequator (C-M), circumferential ellipse (CE) at the equator, or longitudinal ellipse (LE) at the equator. C&D. Circumferential and longitudinal systolic strains were negative prior to infarction (control), indicating contraction. During acute ischemia, apical infarcts stretched during systole in both directions (C); by contrast, infarcts at the equator stretched only in the circumferential direction (D). E&F. Mean collagen orientation histograms show isotropic structure in apical infarcts (E) and circumferential alignment in equatorial infarcts (F).
Figure 4
Figure 4
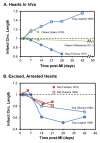
Chronic infarct geometric measurements demonstrate substantial remodeling in the circumferential dimension. A. When assessed in vivo, studies sometimes report infarct expansion (increase in the scar’s circumferential length) and sometimes report compaction (decrease in the scar’s circumferential length). B. When assessed in excised, arrested hearts (i.e., no longer pressurized), studies typically report compaction. These trends are true across multiple animal models and measurement techniques.
Figure 5
Figure 5
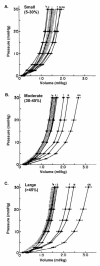
Data from Pfeffer et al. on remodeling of end-diastolic pressure-volume relationship following myocardial infarction in rats (204). Following small infarcts (those affecting 5-30% of the LV circumference), effects of changes in infarct stiffness and cavity dimension offset, producing little change in the EDPVR from 6 hours (1/4 day) to 15 weeks (106 days). By contrast, substantial cavity dilation led to a progressive rightward shift of the EDPVR following larger infarcts. Small numbers at the top of each curve indicate the time post-infarction; error bars are 2*SE for group sizes of 5-10 at most time points and 12-25 at the last two time points. Figure slightly modified with permission from Pfeffer et al. (204).
Figure 6
Figure 6
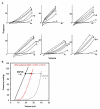
Effect of acute ischemia on the end-systolic pressure-volume relationship (ESPVR). A. Plots from Sunagawa et al. showing a progressive rightward shift in the ESPVR as ischemic regions of increasing size were created in 6 dog hearts (reprinted with permission (251)). A – control; B – distal left circumflex (LCx) artery occlusion; C – proximal left anterior descending (LAD) artery occlusion; D – proximal LCx occlusion; E – distal LAD occlusion; F – mid-LAD occlusion; G – end-diastolic pressure volume relationship (EDPVR). B. Illustration of the compartmental model proposed by Sunagawa et al., for an ischemic region affecting 40% of LV mass. The model predicts the ischemic ESPVR as a weighted average of the normal ESPVR and the EDPVR, which is assumed to reflect the passive mechanical behavior of the acutely ischemic region.
Figure 7
Figure 7
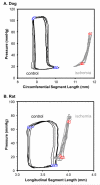
Changes in pressure-segment length curves during acute ischemia. A. Pressure-circumferential segment length loops recorded in our laboratory from an open-chest anesthetized dog with autonomic reflexes pharmacologically blocked. Fifteen minutes of ischemia converted the active loop to an exponential, passive curve, induced a rightward shift, and increased enddiastolic pressure (EDP). B. Pressure-longitudinal segment length loops recorded in our laboratory from an open-chest anesthetized rat with intact autonomic reflexes. Thirty minutes of ischemia converted the active loop to a passive curve and increased EDP, shifting the segment onto a steeper region of that curve. Blue triangles – control end diastole (ED); blue circles – control end systole (ES); red triangles – ischemia ED; red circles – ischemic ES.
Figure 8
Figure 8
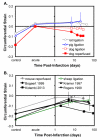
Changes in regional mechanics during infarct healing. A. Circumferential strains reflecting deformation from end diastole to end systole measured using radiopaque markers (pig, Holmes et al. (114)) or sonomicrometers (rat, Fomovsky et al. (73); dog, Theroux et al. (258, 259)) drop to near zero acutely and remain small (usually not significantly different from zero) for several weeks after infarction in most studies. However, Theroux and coworkers found that shortening partly recovered in dogs with reperfused infarcts (closed squares), in contrast to dogs with permanent ligation studied using otherwise identical methods (open squares). B. Circumferential strains measured using MRI showed gradual recovery in patients with reperfused MI (black curves; (22, 136, 148, 228)) but not in mice with reperfused MI (295), or sheep with permanent ligations (147).
Figure 9
Figure 9
Effect of infarct size on left ventricular remodeling. A. Measurements of LV remodeling 1 year post-MI in patients revealed that end systolic volume is linearly related to acute infarct size. Plot reprinted with permission from Chareonthaitawee et al. (41). B. EDPVRs of rats with a healed MI were generated by passive inflation of the arrested LV. Shifts in the average curves show that for a given LV pressure (LVP), LV cavity volume increases monotonically with infarct size. Plot reprinted with permission from Fletcher et al. (71).
Figure 10
Figure 10
Effects of infarct mechanical properties on passive and active left ventricular function. A&B. Original model results reprinted with permission from Bogen (23). A. Immediately post MI, the non-contractile ischemic area causes severe systolic dysfunction (characterized by a rightward shift in the ESPVR) with minimal effect on passive LV behavior. Systolic function improves (ESPVR shifts leftward towards baseline) as the infarct stiffens throughout healing, but the stiffer scar also impairs diastolic filling (steepening of the EDPVR). B. Unfortunately, similar magnitude shifts in these two curves can offset each other, leading to minimal improvement in stroke volume as the scar stiffens. C&D. Experimental results reprinted with permission from Fomovsky (72). C. Changes in passive and active LV behavior with infarction and anisotropic infarct reinforcement. Selective longitudinal reinforcement shifts the ESPVR leftward with minimal effect on the EDPVR. D. Anisotropic infarct reinforcement improves systolic function without impairing diastolic filling, leading to better pump function as indicated by an upward shift in the CO curve.
Figure 11
Figure 11
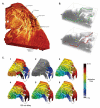
A. Three-dimensional reconstruction of an infarcted region (2.99×2.68×0.70 mm3 volume). B. Representative activation pathways with stimulation at the sub-endocardium (top) or sub-epicardium (bottom), demonstrating tortuous stimulus site-dependent activation pathways through the infarct. C. Sustained re-entry in the infarcted region induced by a stimulus train with reducing cycle length applied at the sub-epicardium (red sphere). The sub-epicardium and subendocardium were coupled at the network boundary via a path (dashed line) that imposed a time delay. Shown are activation maps for beats 1 to 6 (beats 1-2 were paced with a cycle length of 157 ms, then, following unidirectional block, re-entrant activation occurred in beats 3-6). The marker • indicates the basal sub-epicardium and is used as a fiducial reference. Modified with permission from Rutherford et al. (232).
Figure 12
Figure 12
Effect of various therapeutic modulations on collagen content post-myocardial infarction (post-MI). Both pharmacologic and genetic perturbations have been utilized to significantly modify the collagen content within myocardial scar. Some of these effects resulted from intentional modulation of collagen synthesis or MMP-mediated degradation within the scar (e.g., via prolyl-4-hydroxylase, MMP, or TIMP activity), while some resulted as bi-products of modulating remote cardiomyocyte signaling (e.g., via angiotensin or beta-adrenergic pathways). Bars represent means and standard deviations across available studies (see text for references).
Figure 13
Figure 13
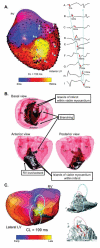
A. Isochronal map generated from epicardial sock data (black dots indicate location of the electrodes) during re-entry (left) and signals from bipolar electrograms at respective locations showing progression of electrical activation traveling from point A to I (right). B. Three-dimensional infarct geometry reconstructed from high-resolution contrast-enhanced magnetic resonance imaging (0.39×0.39×0.39 mm spatial resolution). The infarcted region is represented by dark gray and the normal myocardium by pink. Islands of viable myocardium within the scar, as well as islands of scar within the viable myocardium, are present. C. Combined electrical and structural data showing the re-entrant isthmus located at the postero-apical segment of the infarcted region (circumscribed by a broken red line). The scar geometry at the isthmus was characterized by scar tissue interspersed with multiple tracts of viable myocardium. Possible electrical propagation at the infarct border-zone is indicated by the dashed red arrow. Modified with permission from Ashikaga et al. (6).

References

    1. Amigoni M, Meris A, Thune JJ, Mangalat D, Skali H, Bourgoun M, Warnica JW, Barvik S, Arnold JMO, Velazquez EJ, Van de Werf F, Ghali J, McMurray JJV, Køber L, Pfeffer M, Solomon SD. Mitral regurgitation in myocardial infarction complicated by heart failure, left ventricular dysfunction, or both: prognostic significance and relation to ventricular size and function. Eur Heart J. 2007;28:326–33. - PubMed
    1. Antoni ML, Boden H, Hoogslag GE, Ewe SH, Auger D, Holman ER, van der Wall EE, Schalij MJ, Bax JJ, Delgado V. Prevalence of dyssynchrony and relation with long-term outcome in patients after acute myocardial infarction. Am J Cardiol. 2011;108:1689–96. - PubMed
    1. Arevalo H, Plank G, Helm P, Halperin H, Trayanova N. Tachycardia in post-infarction hearts: insights from 3D image-based ventricular models. PLoS One. 2013;8:e68872. - PMC - PubMed
    1. Aronson D, Goldsher N, Zukermann R, Kapeliovich M, Lessick J, Mutlak D, Dabbah S, Markiewicz W, Beyar R, Hammerman H, Reisner S, Agmon Y. Ischemic mitral regurgitation and risk of heart failure after myocardial infarction. Arch Intern Med. 2006;166:2362–8. - PubMed
    1. Arruda M, Fahmy T, Armaganijan L, Di Biase L, Patel D, Natale A. Endocardial and epicardial mapping and catheter ablation of post myocardial infarction ventricular tachycardia: A substrate modification approach. J Interv Card Electrophysiol. 2010;28:137–45. - PubMed

Publication types